SE Asia Drought Monitor: 2015 and 2026

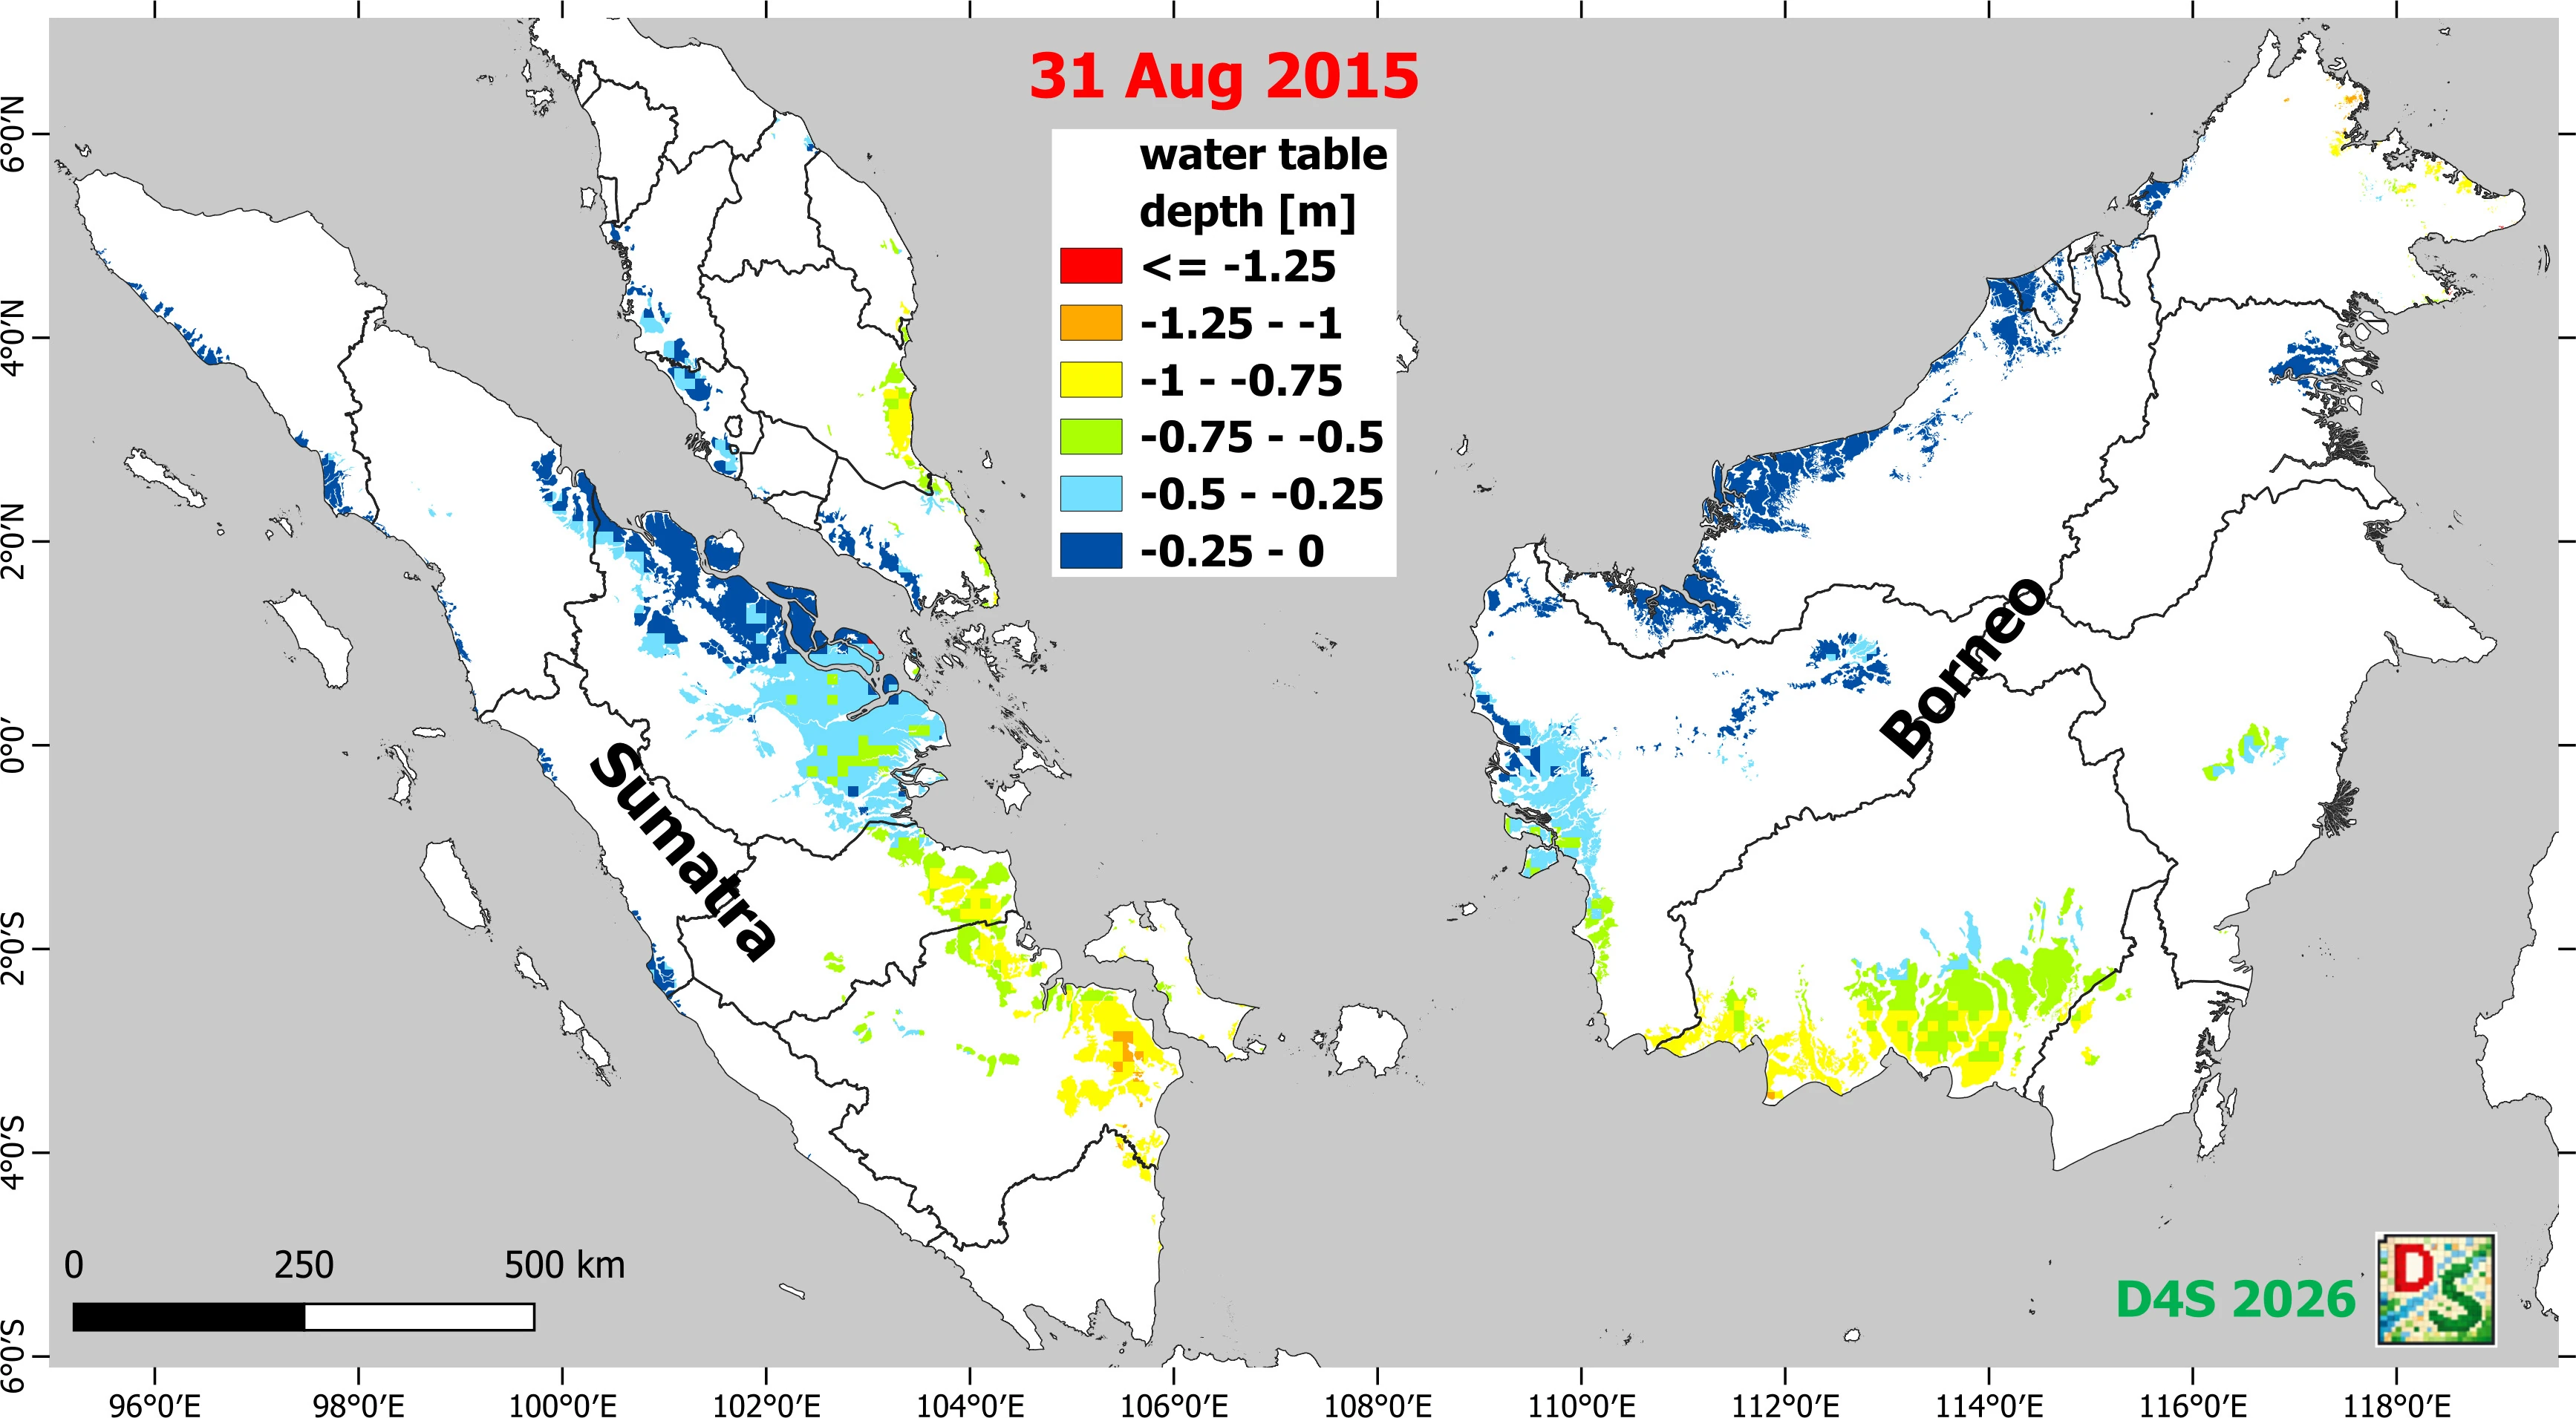
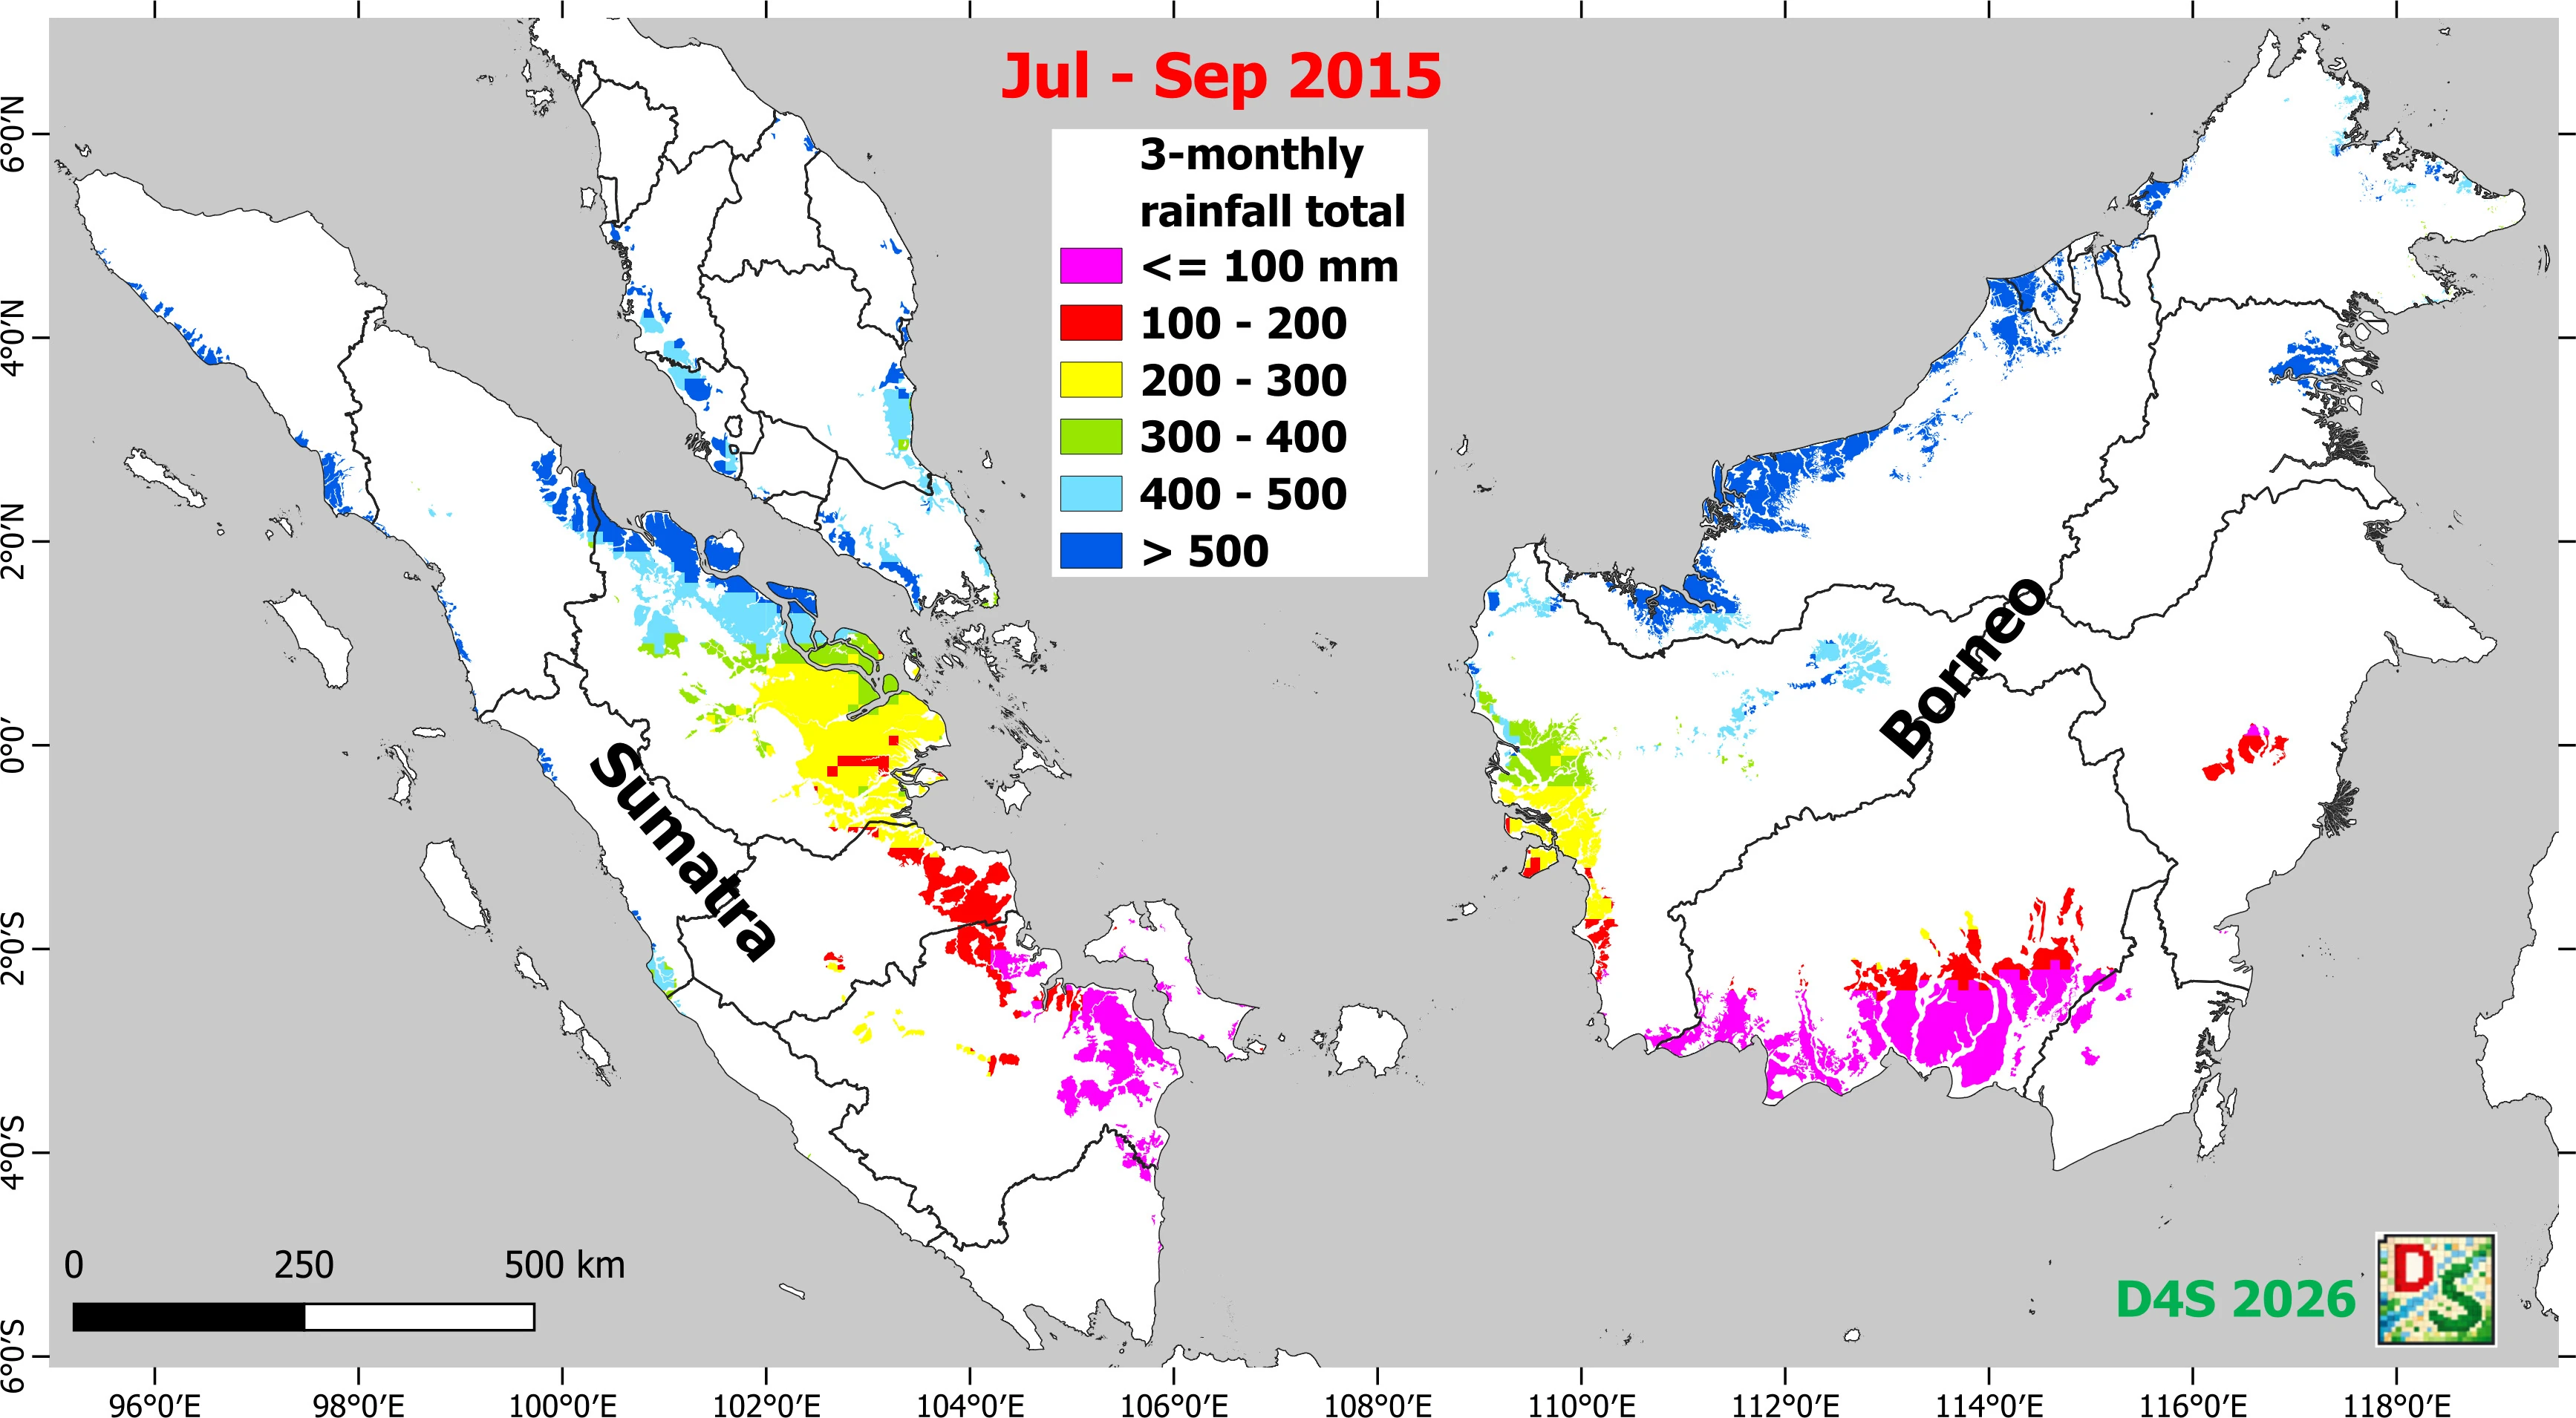
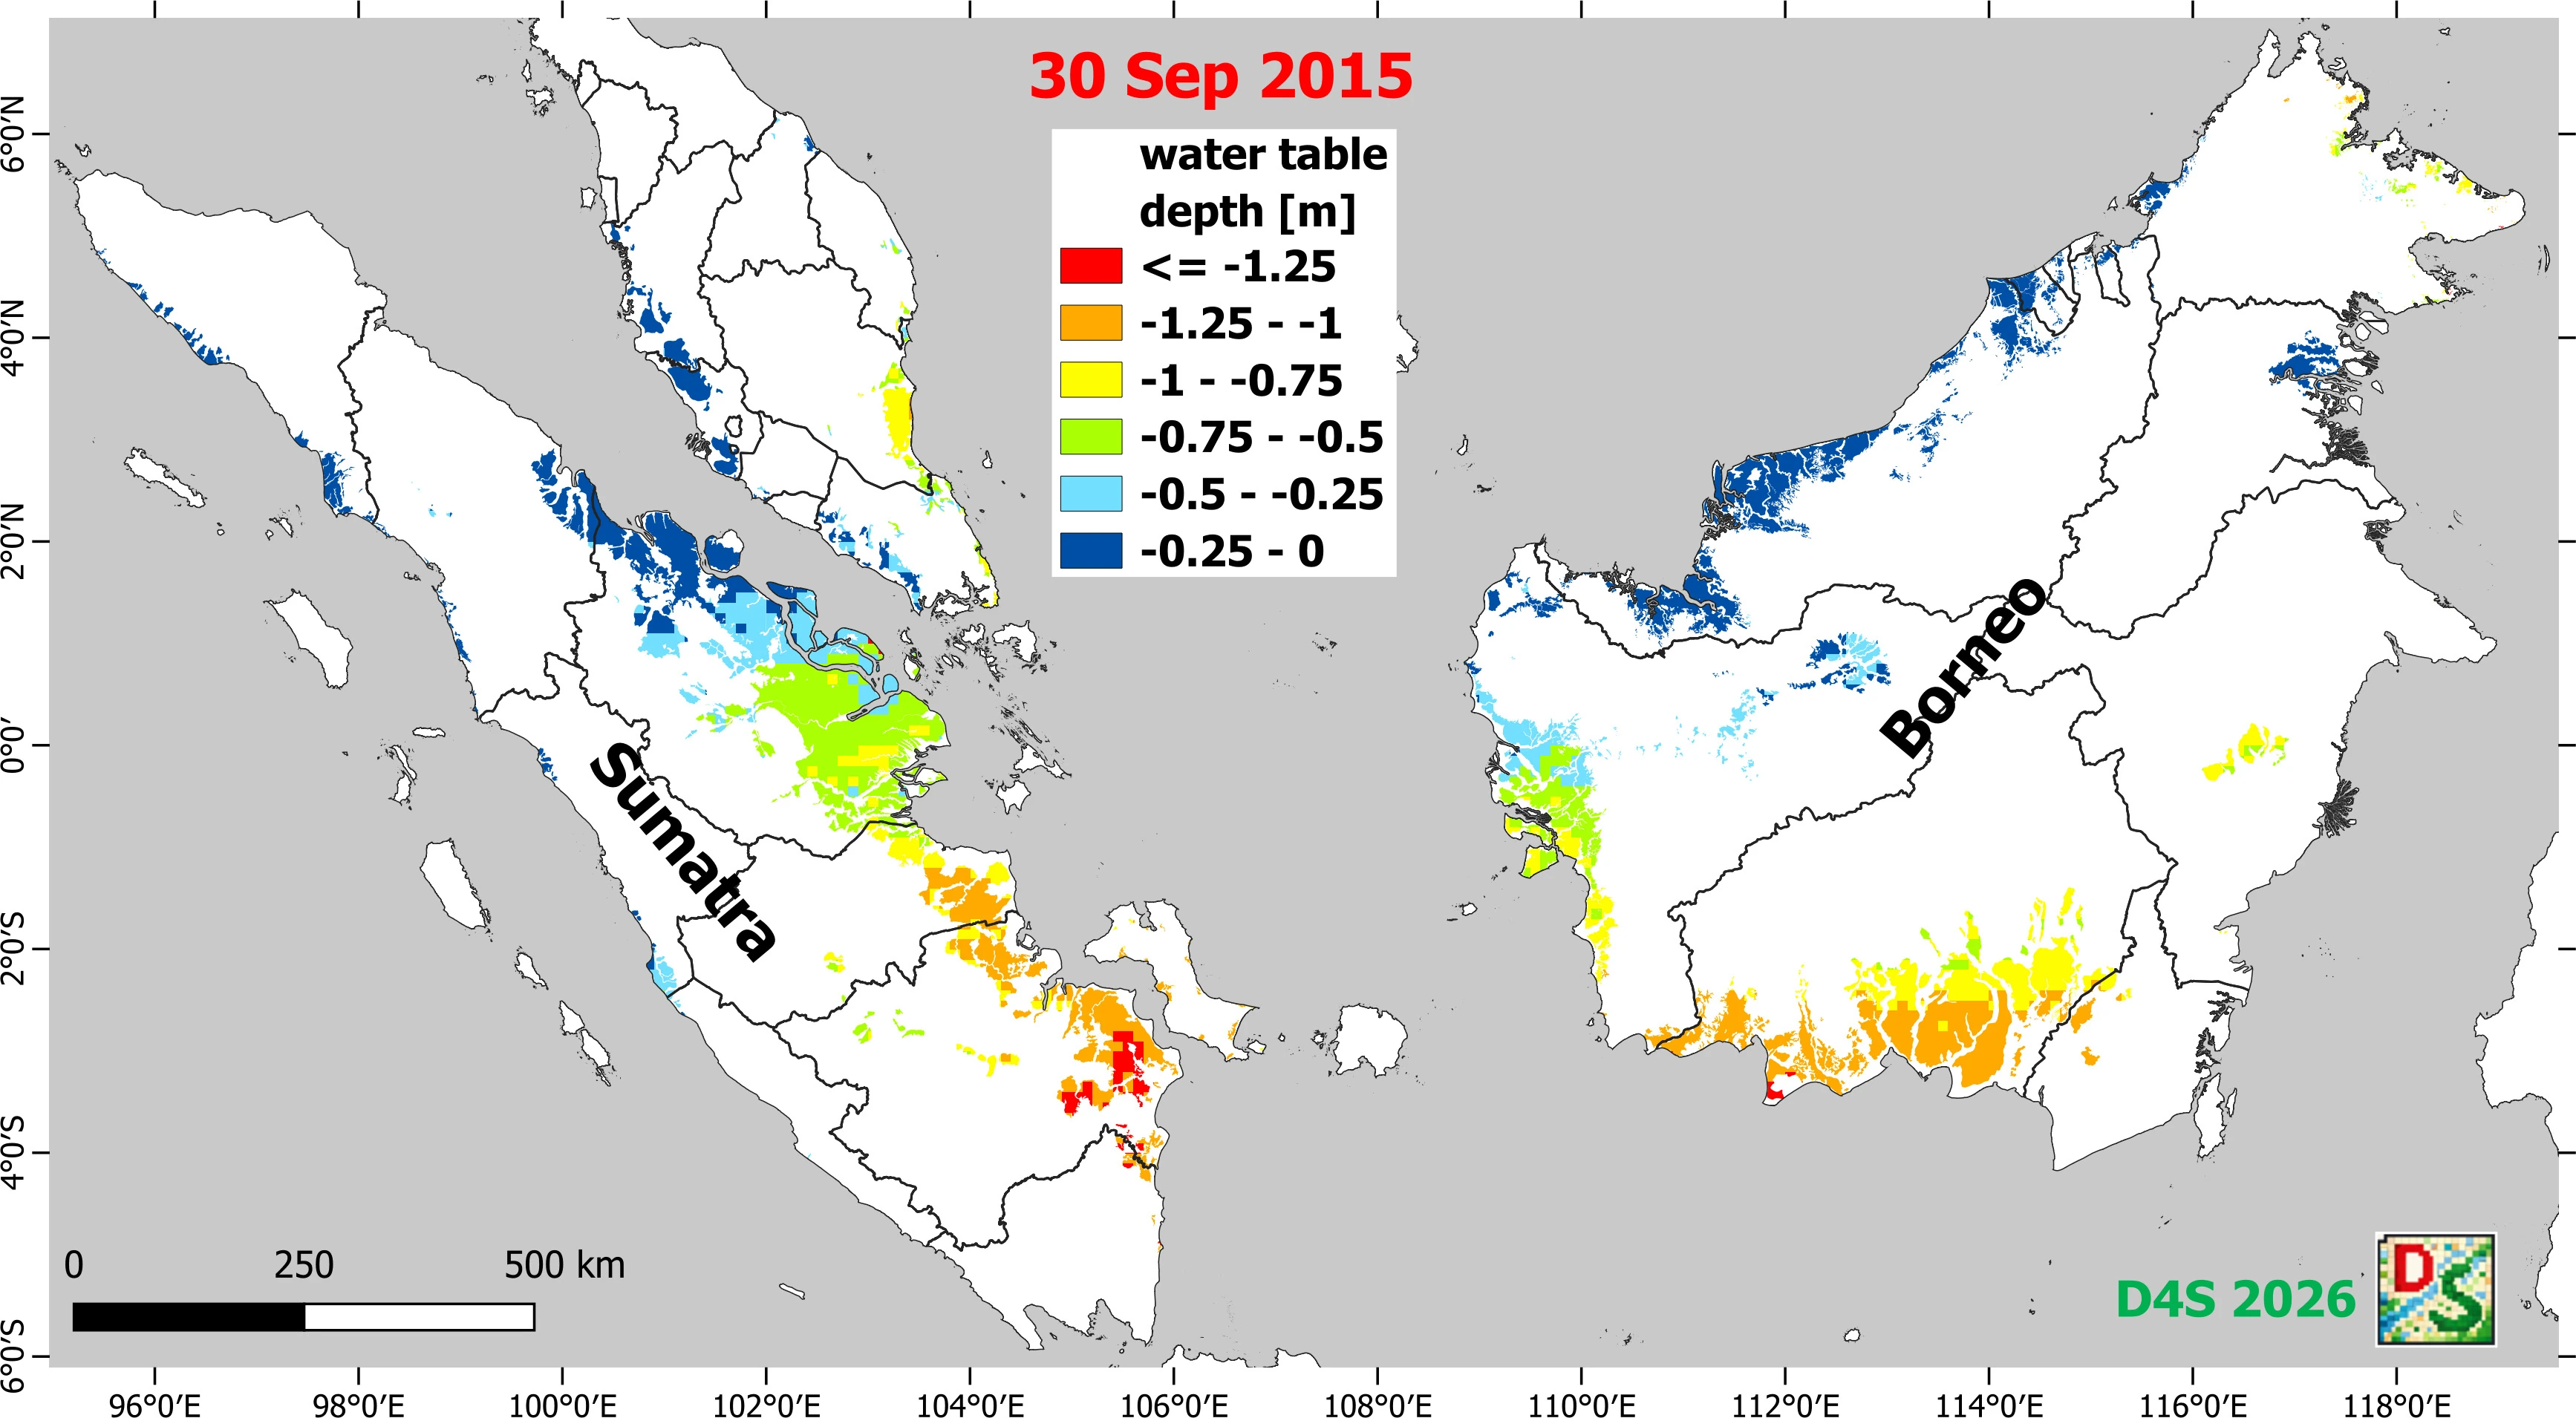
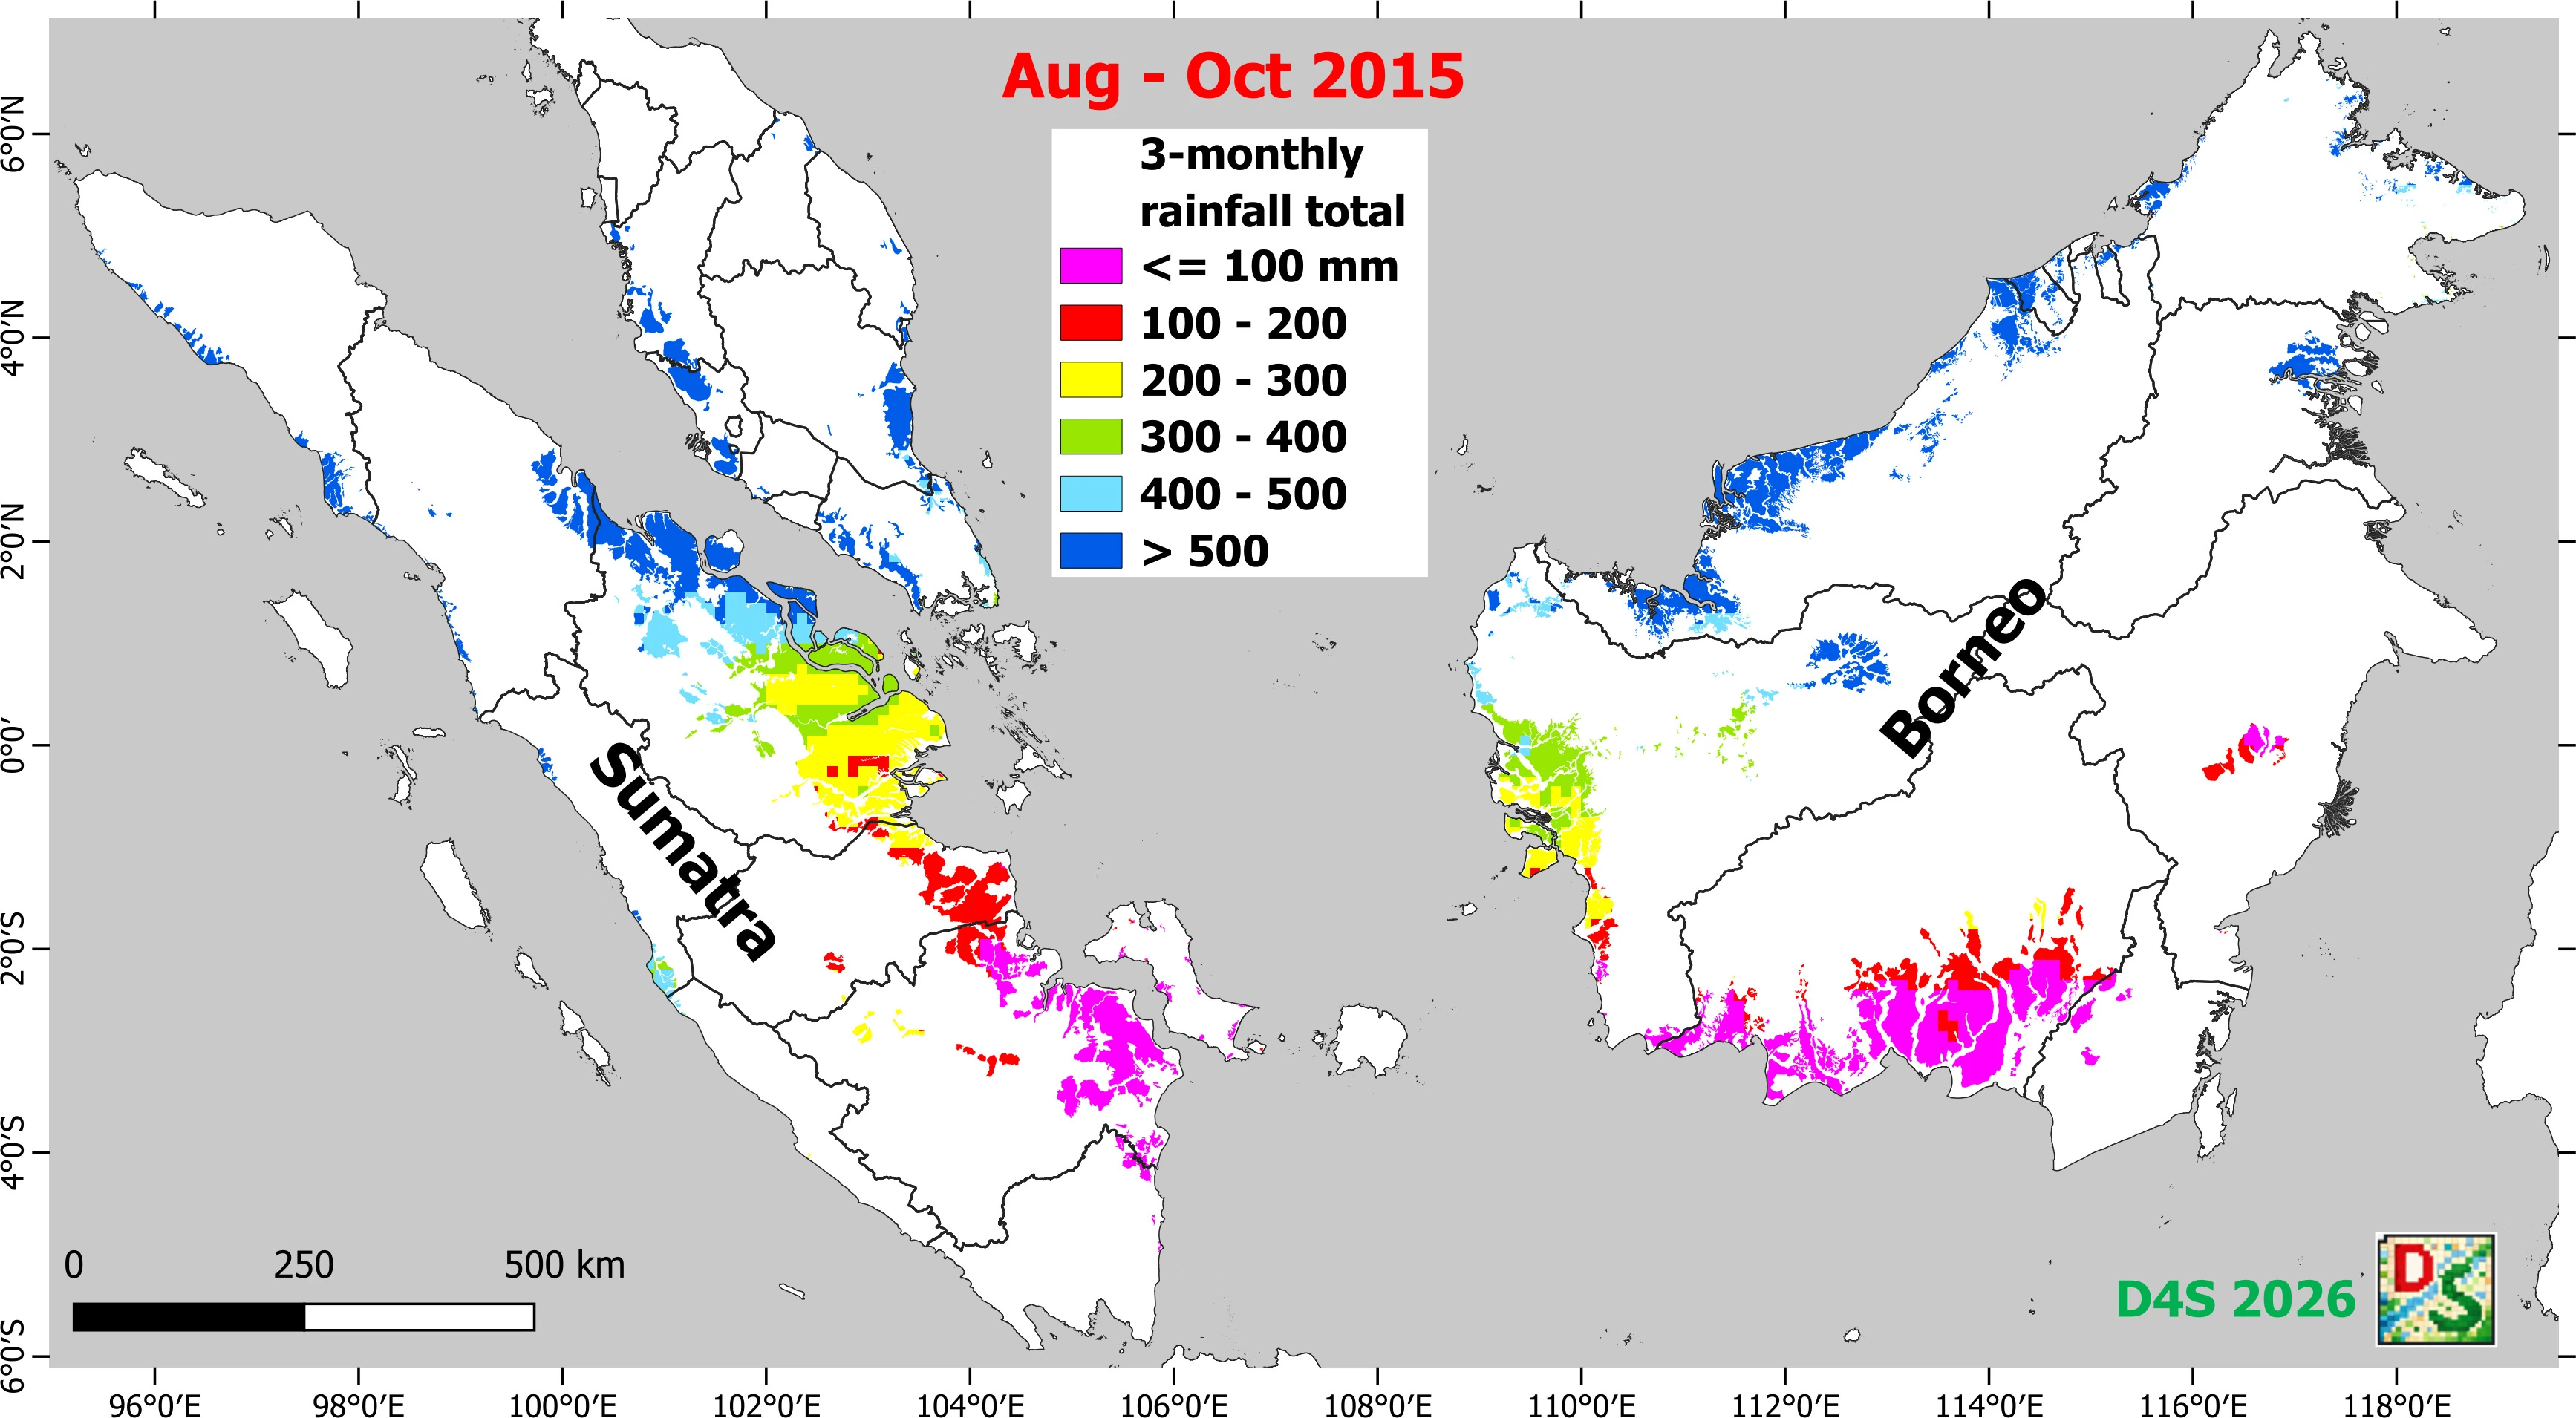
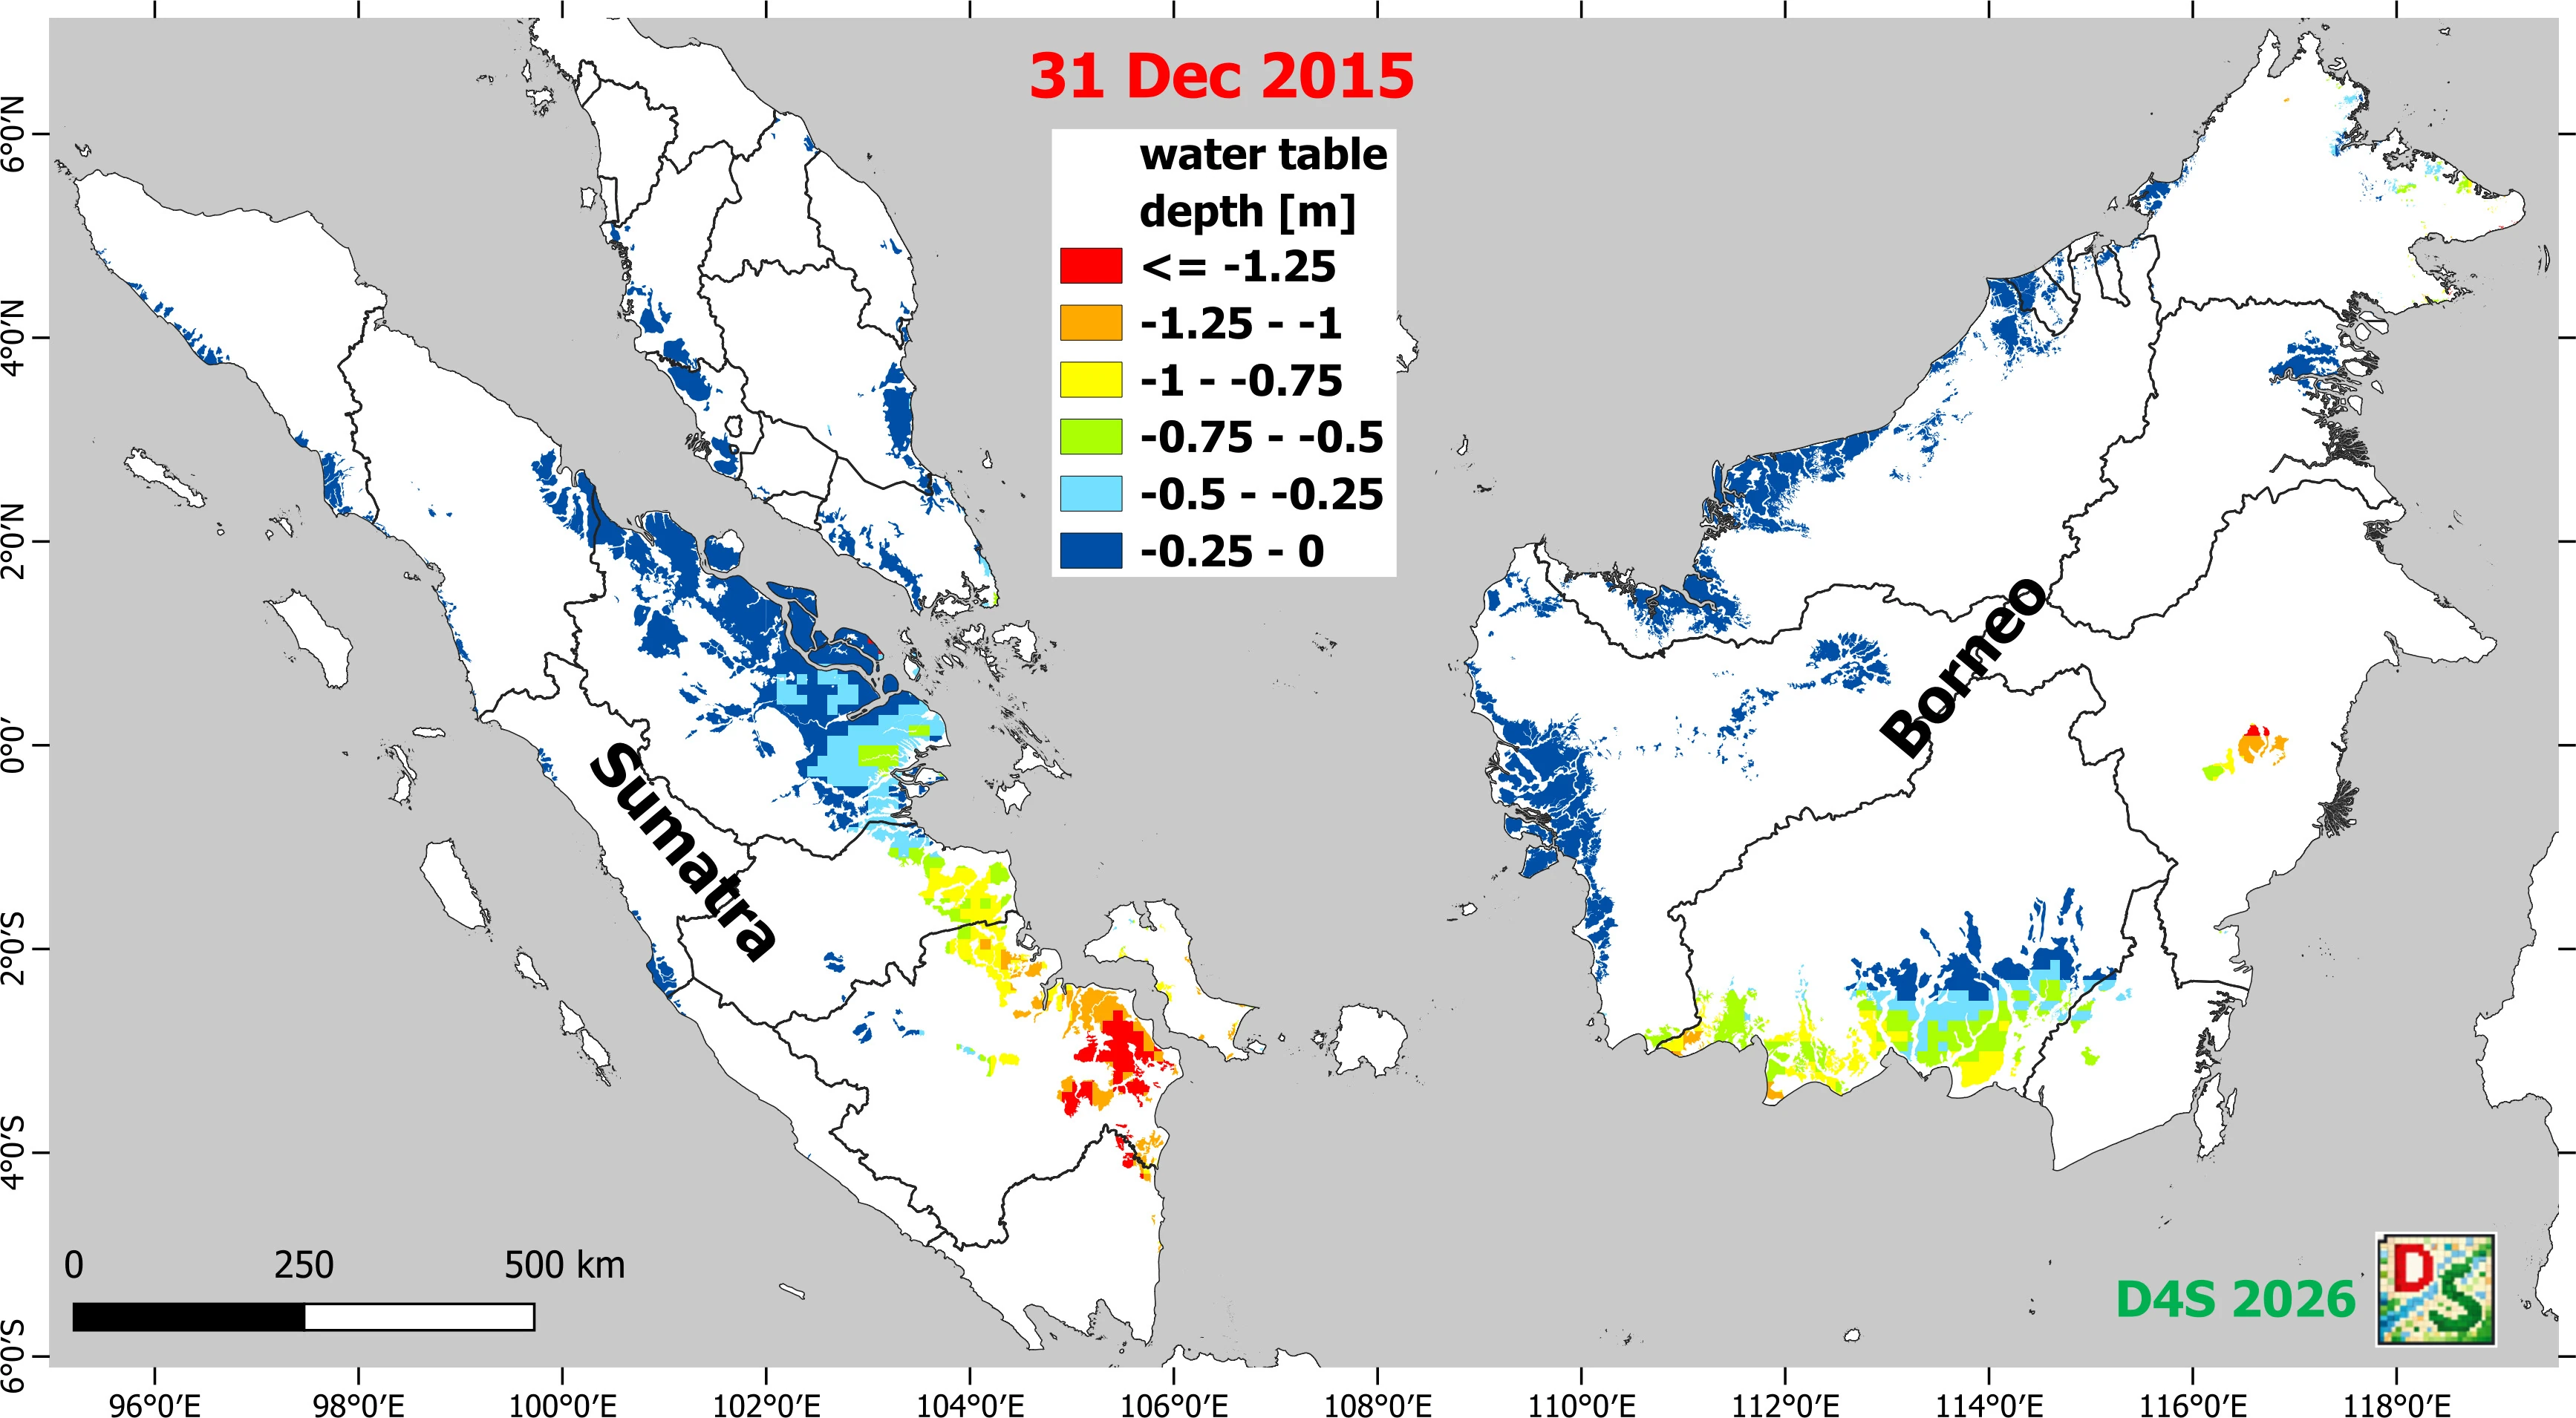
3-month rainfall total and modelled water table depth, 2015 and 2026

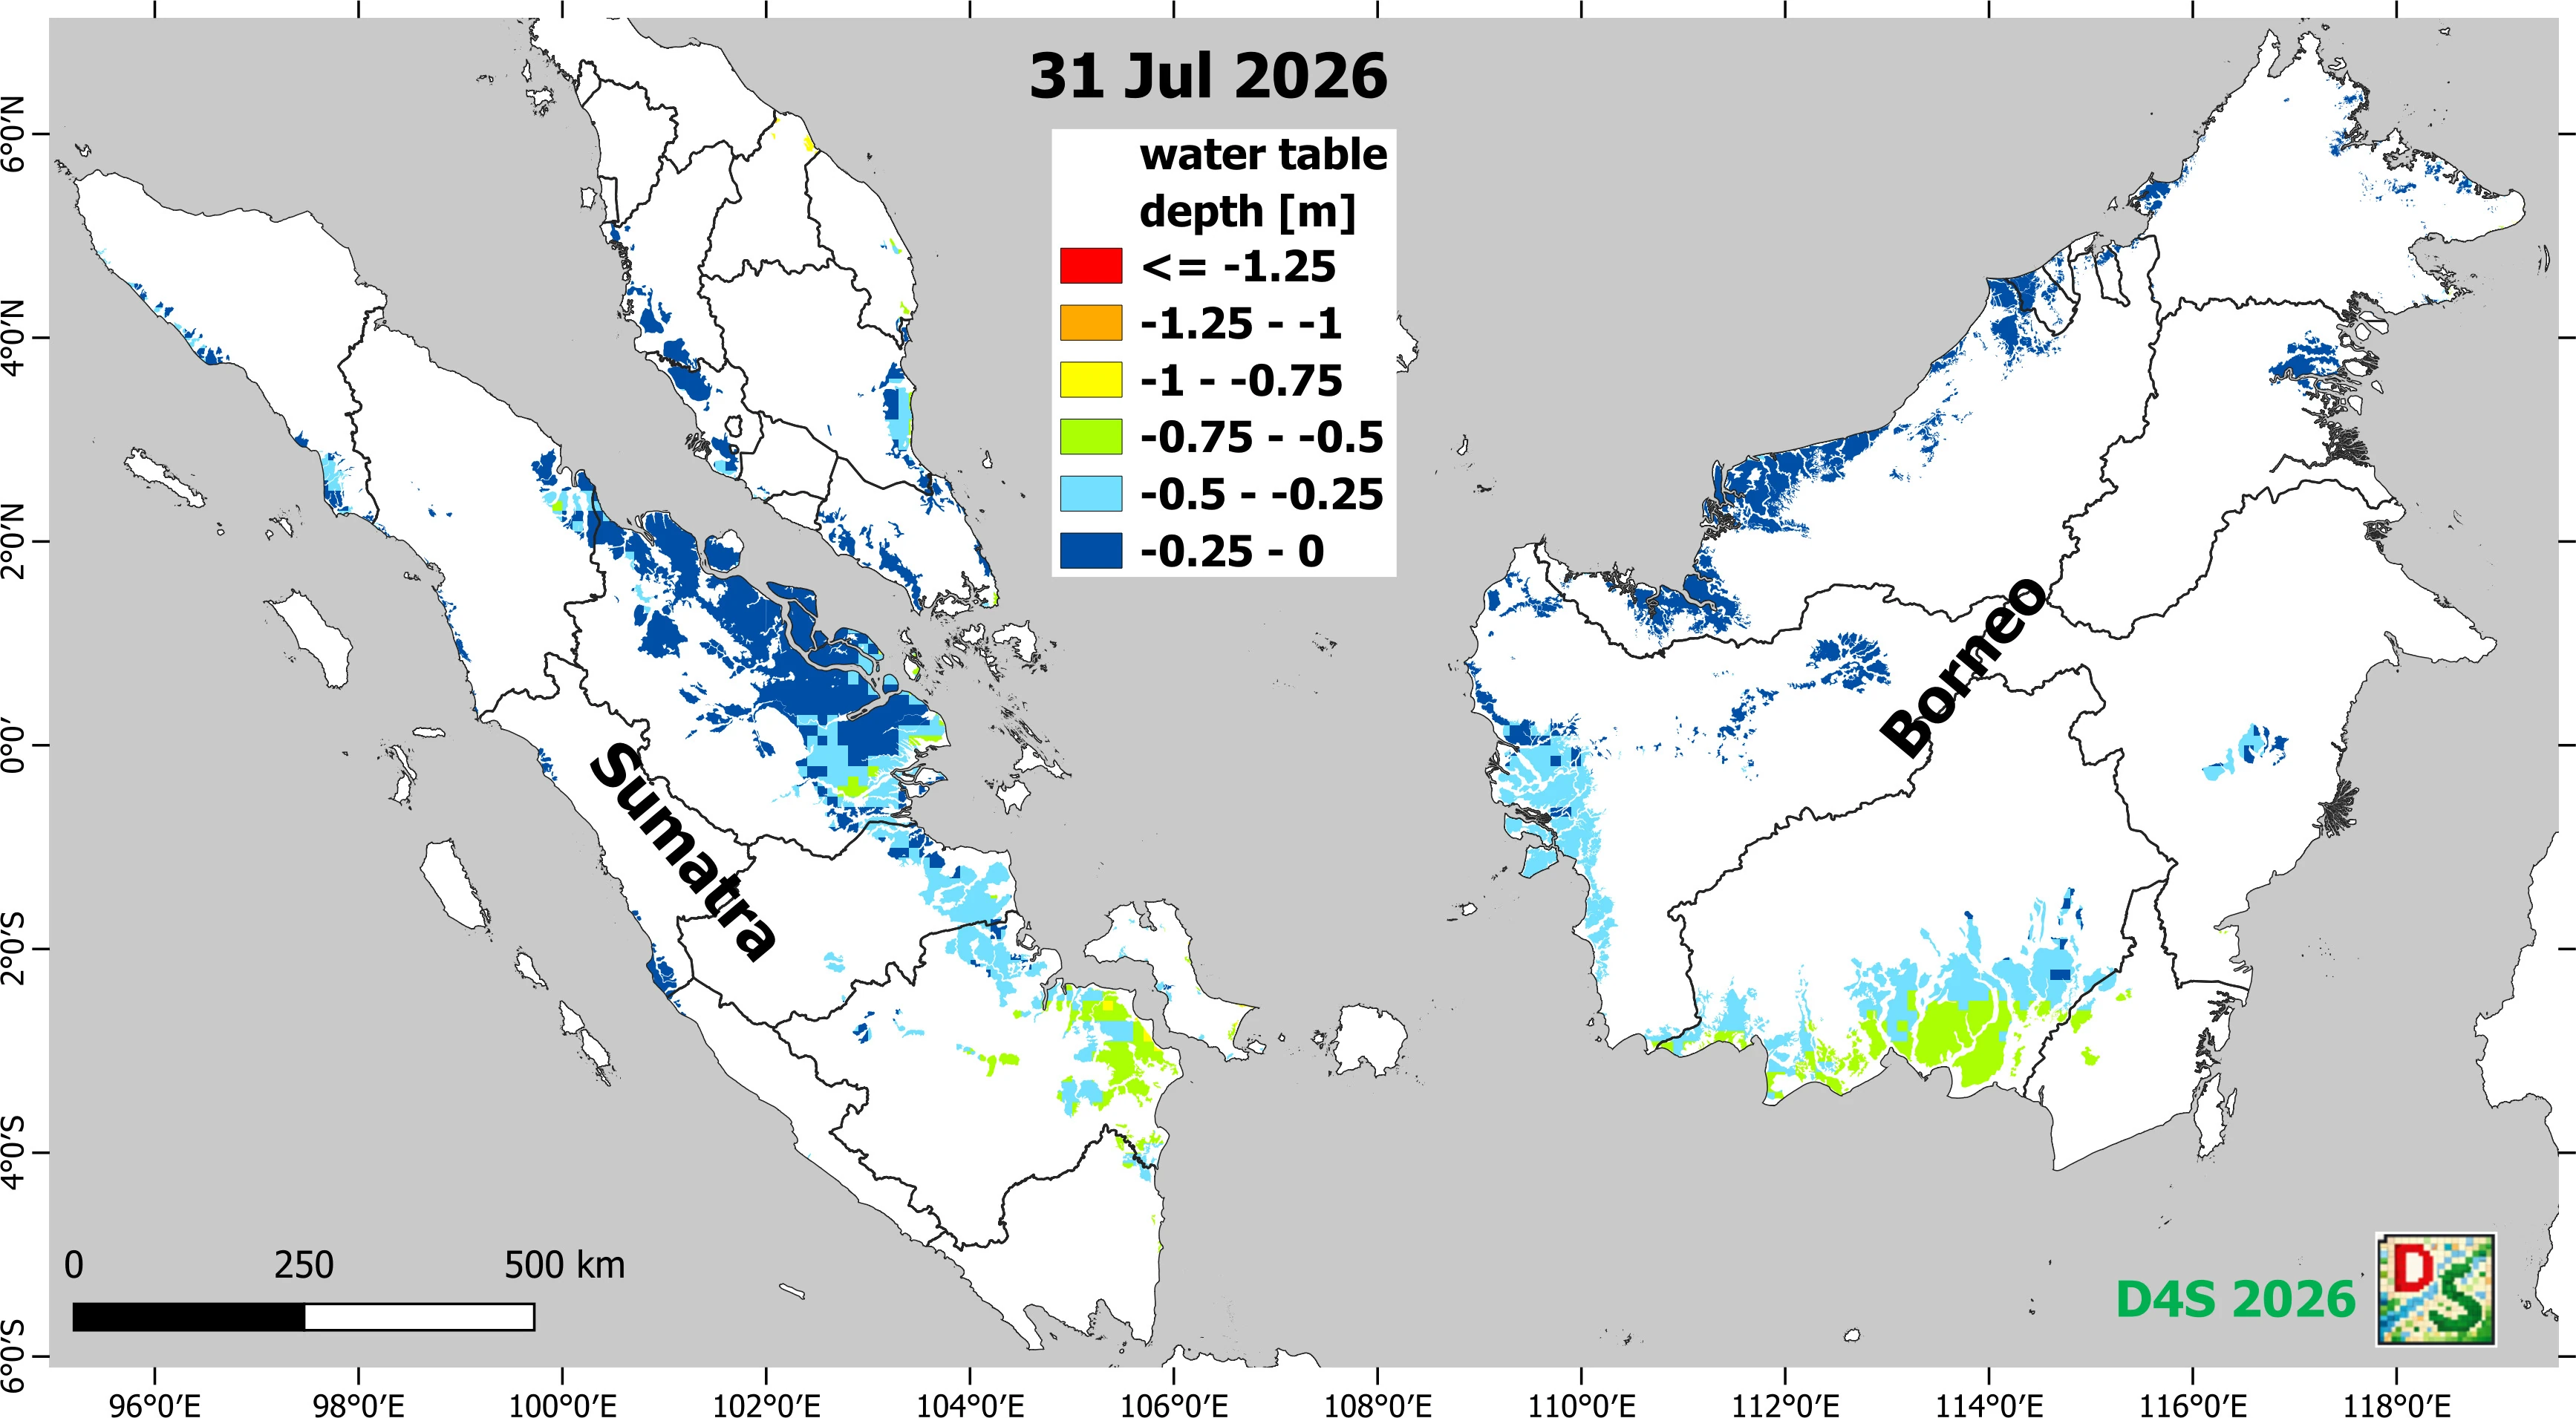
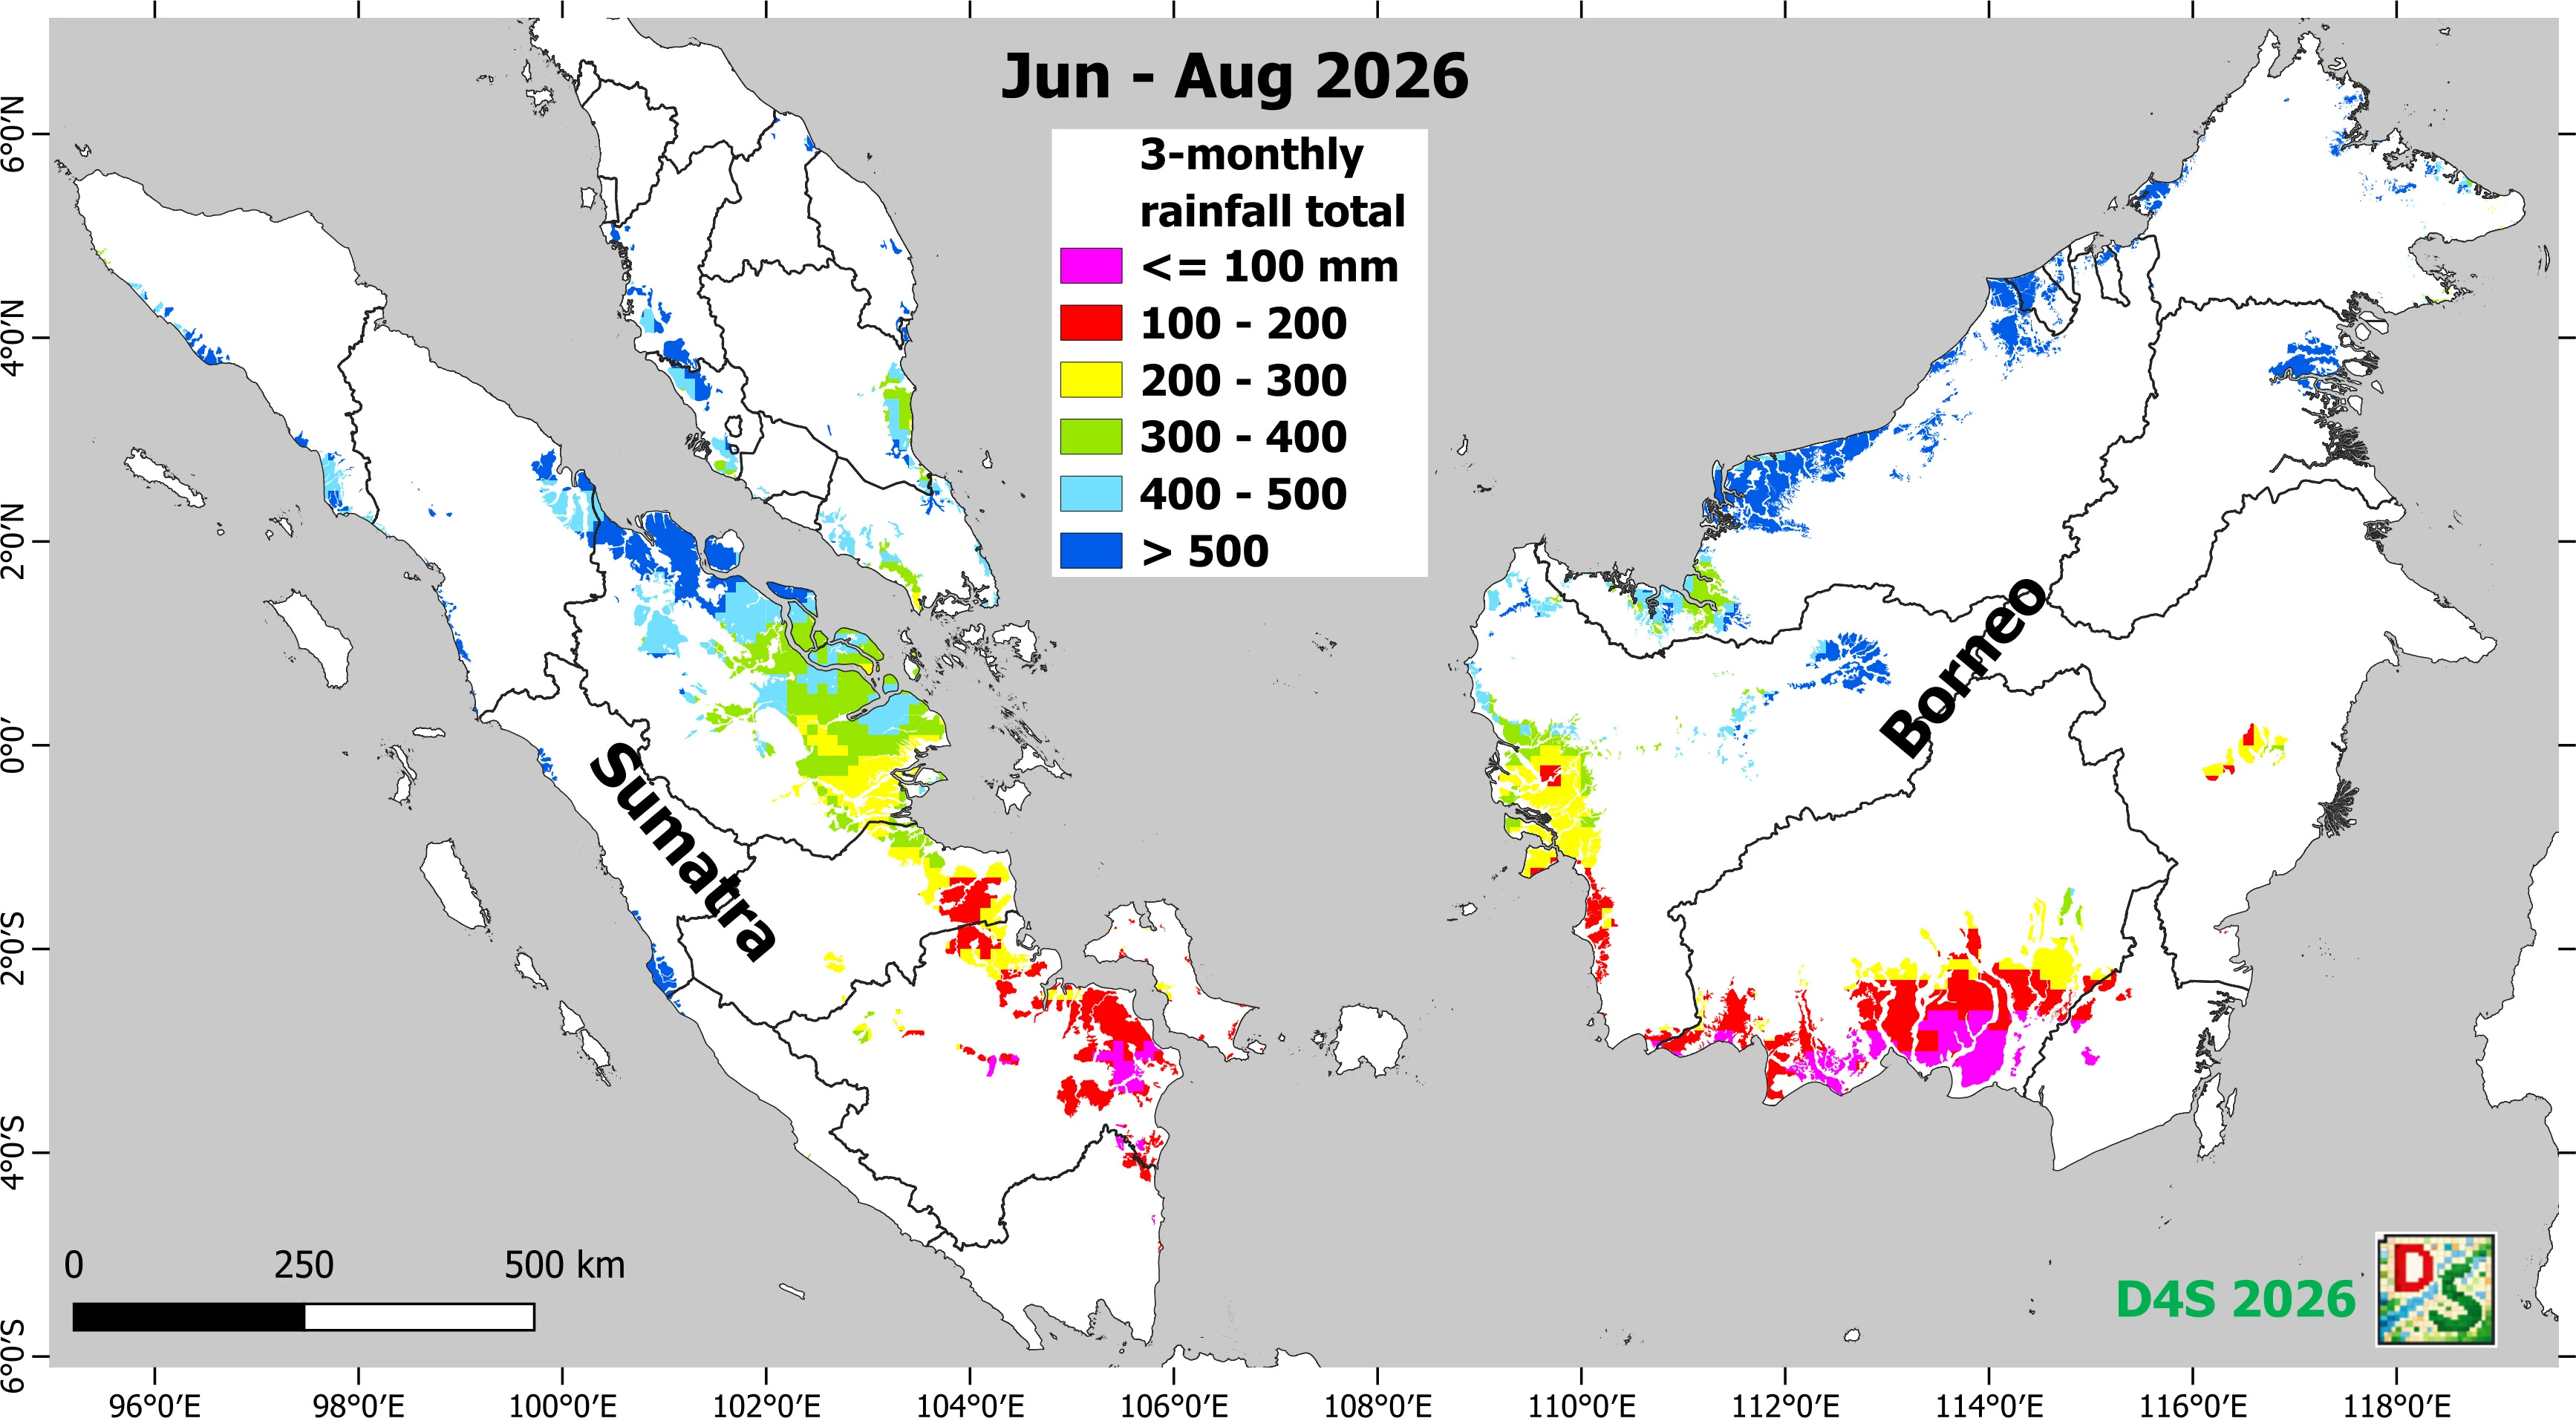
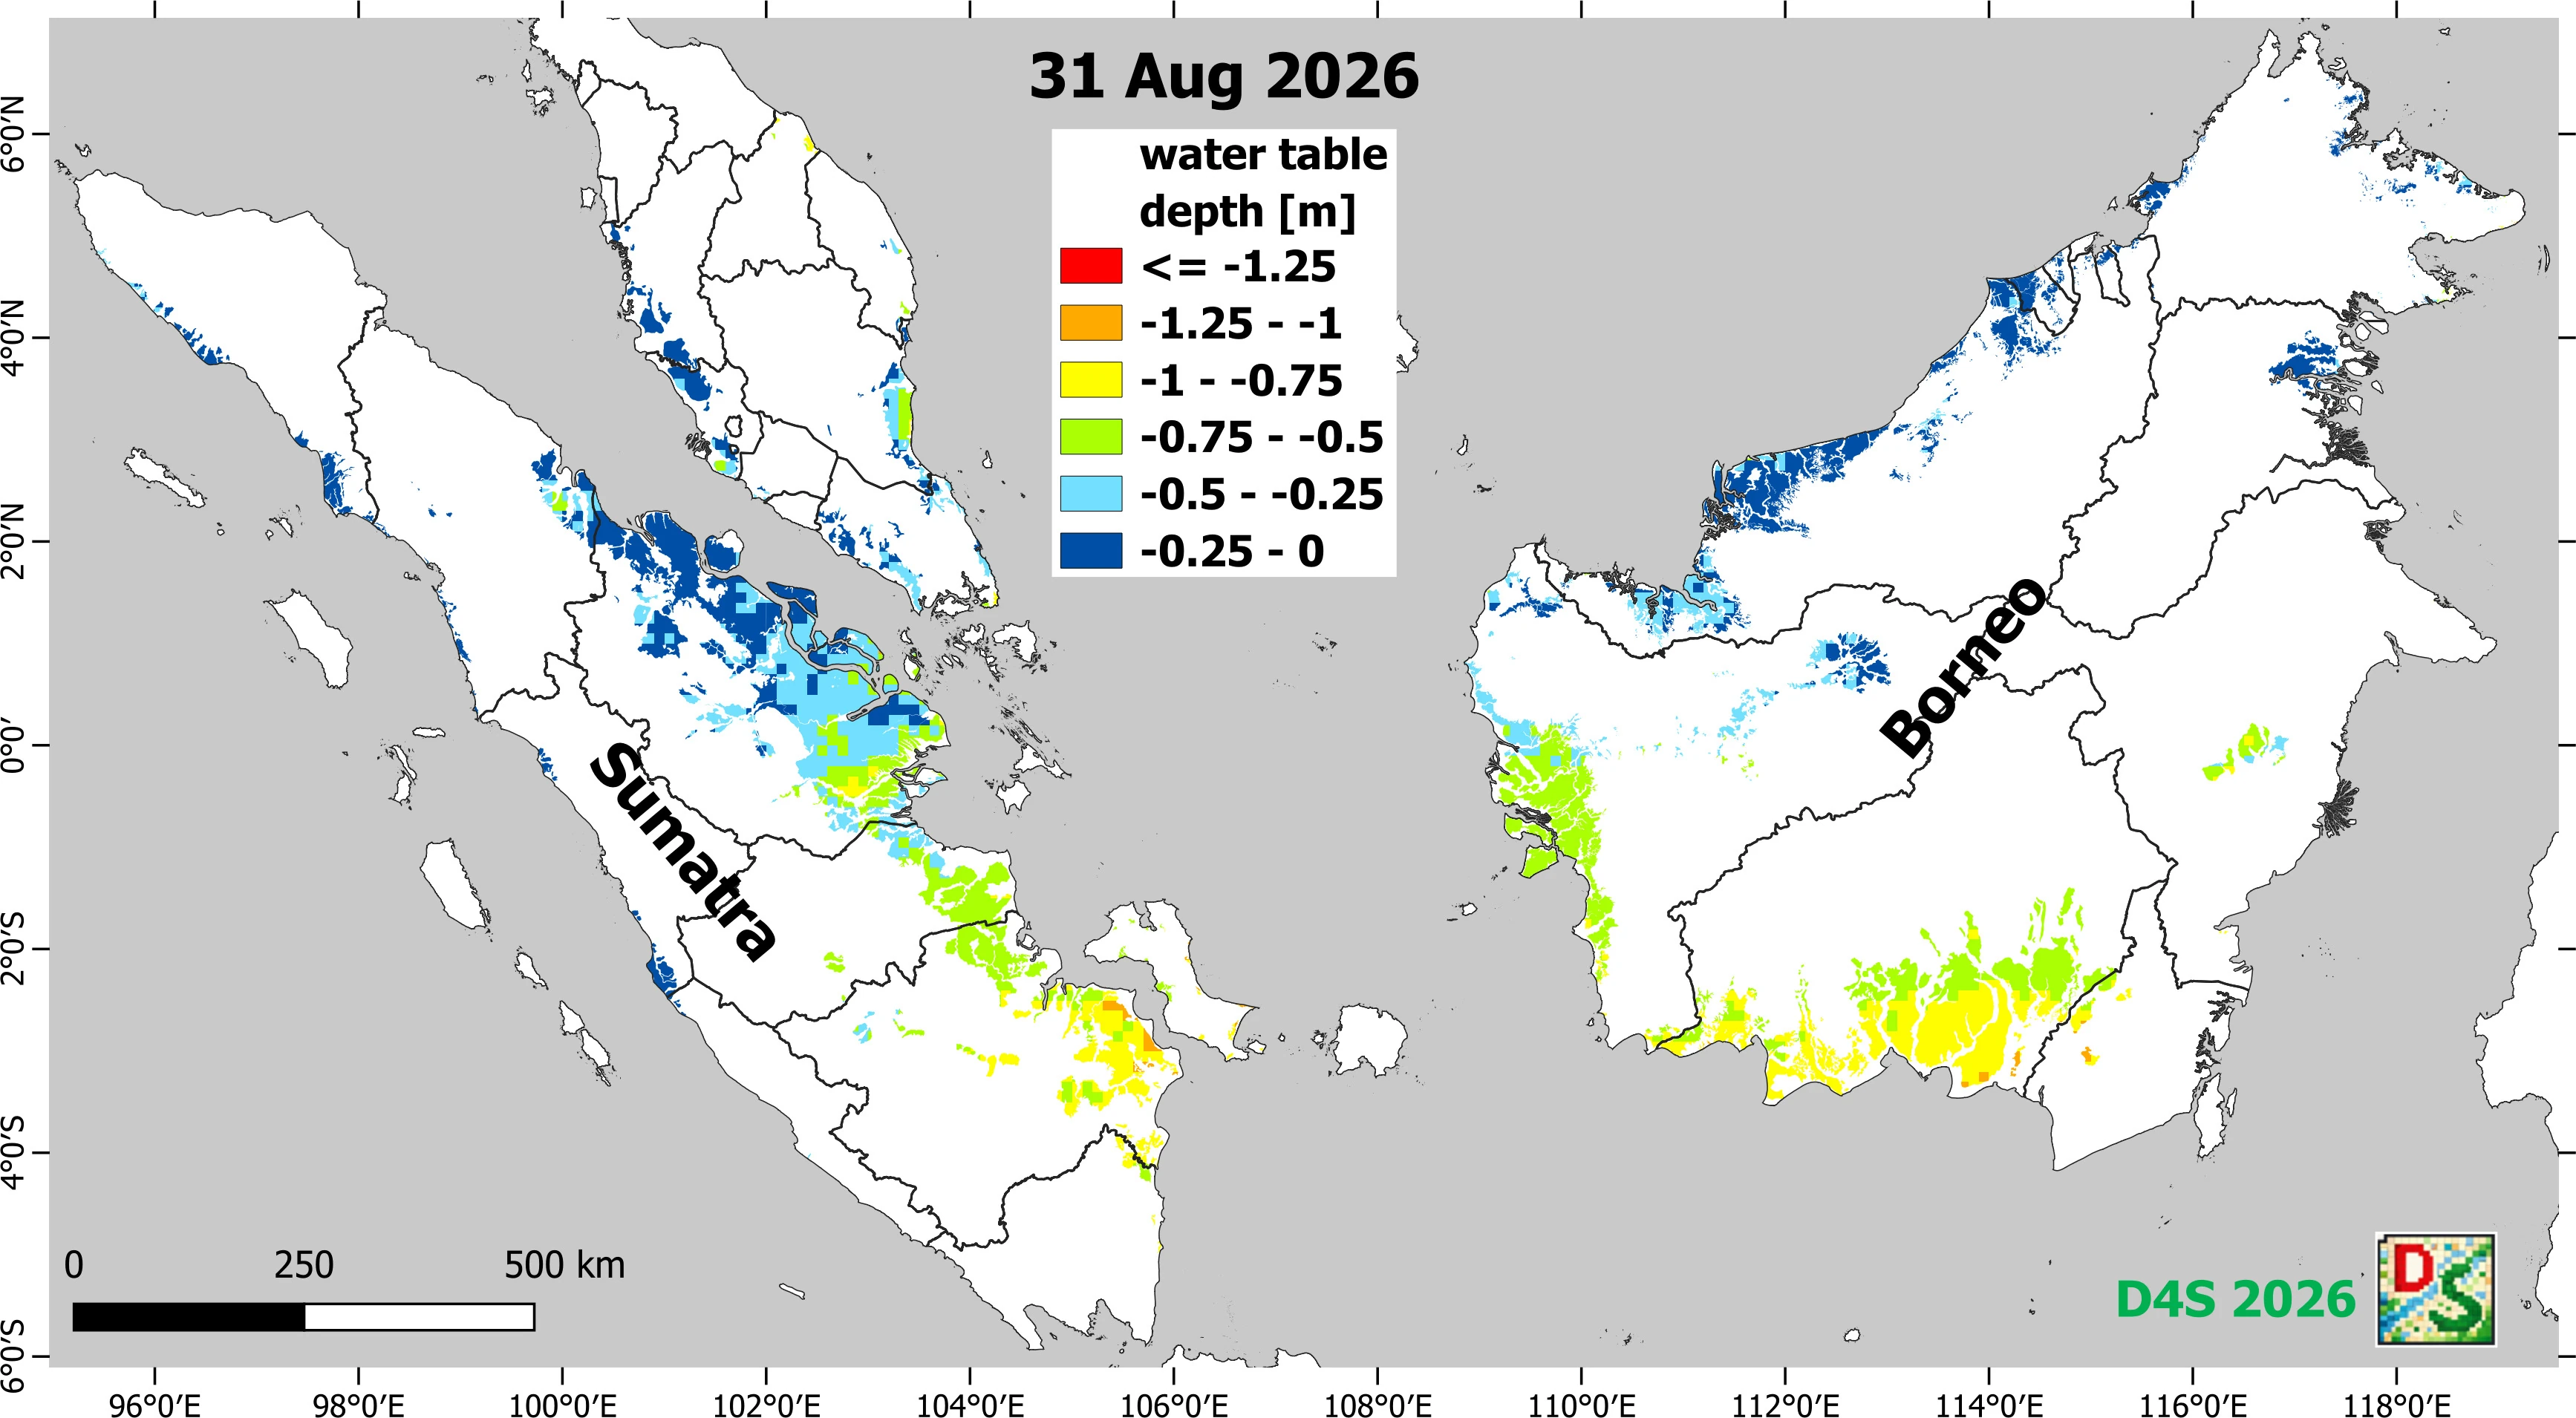
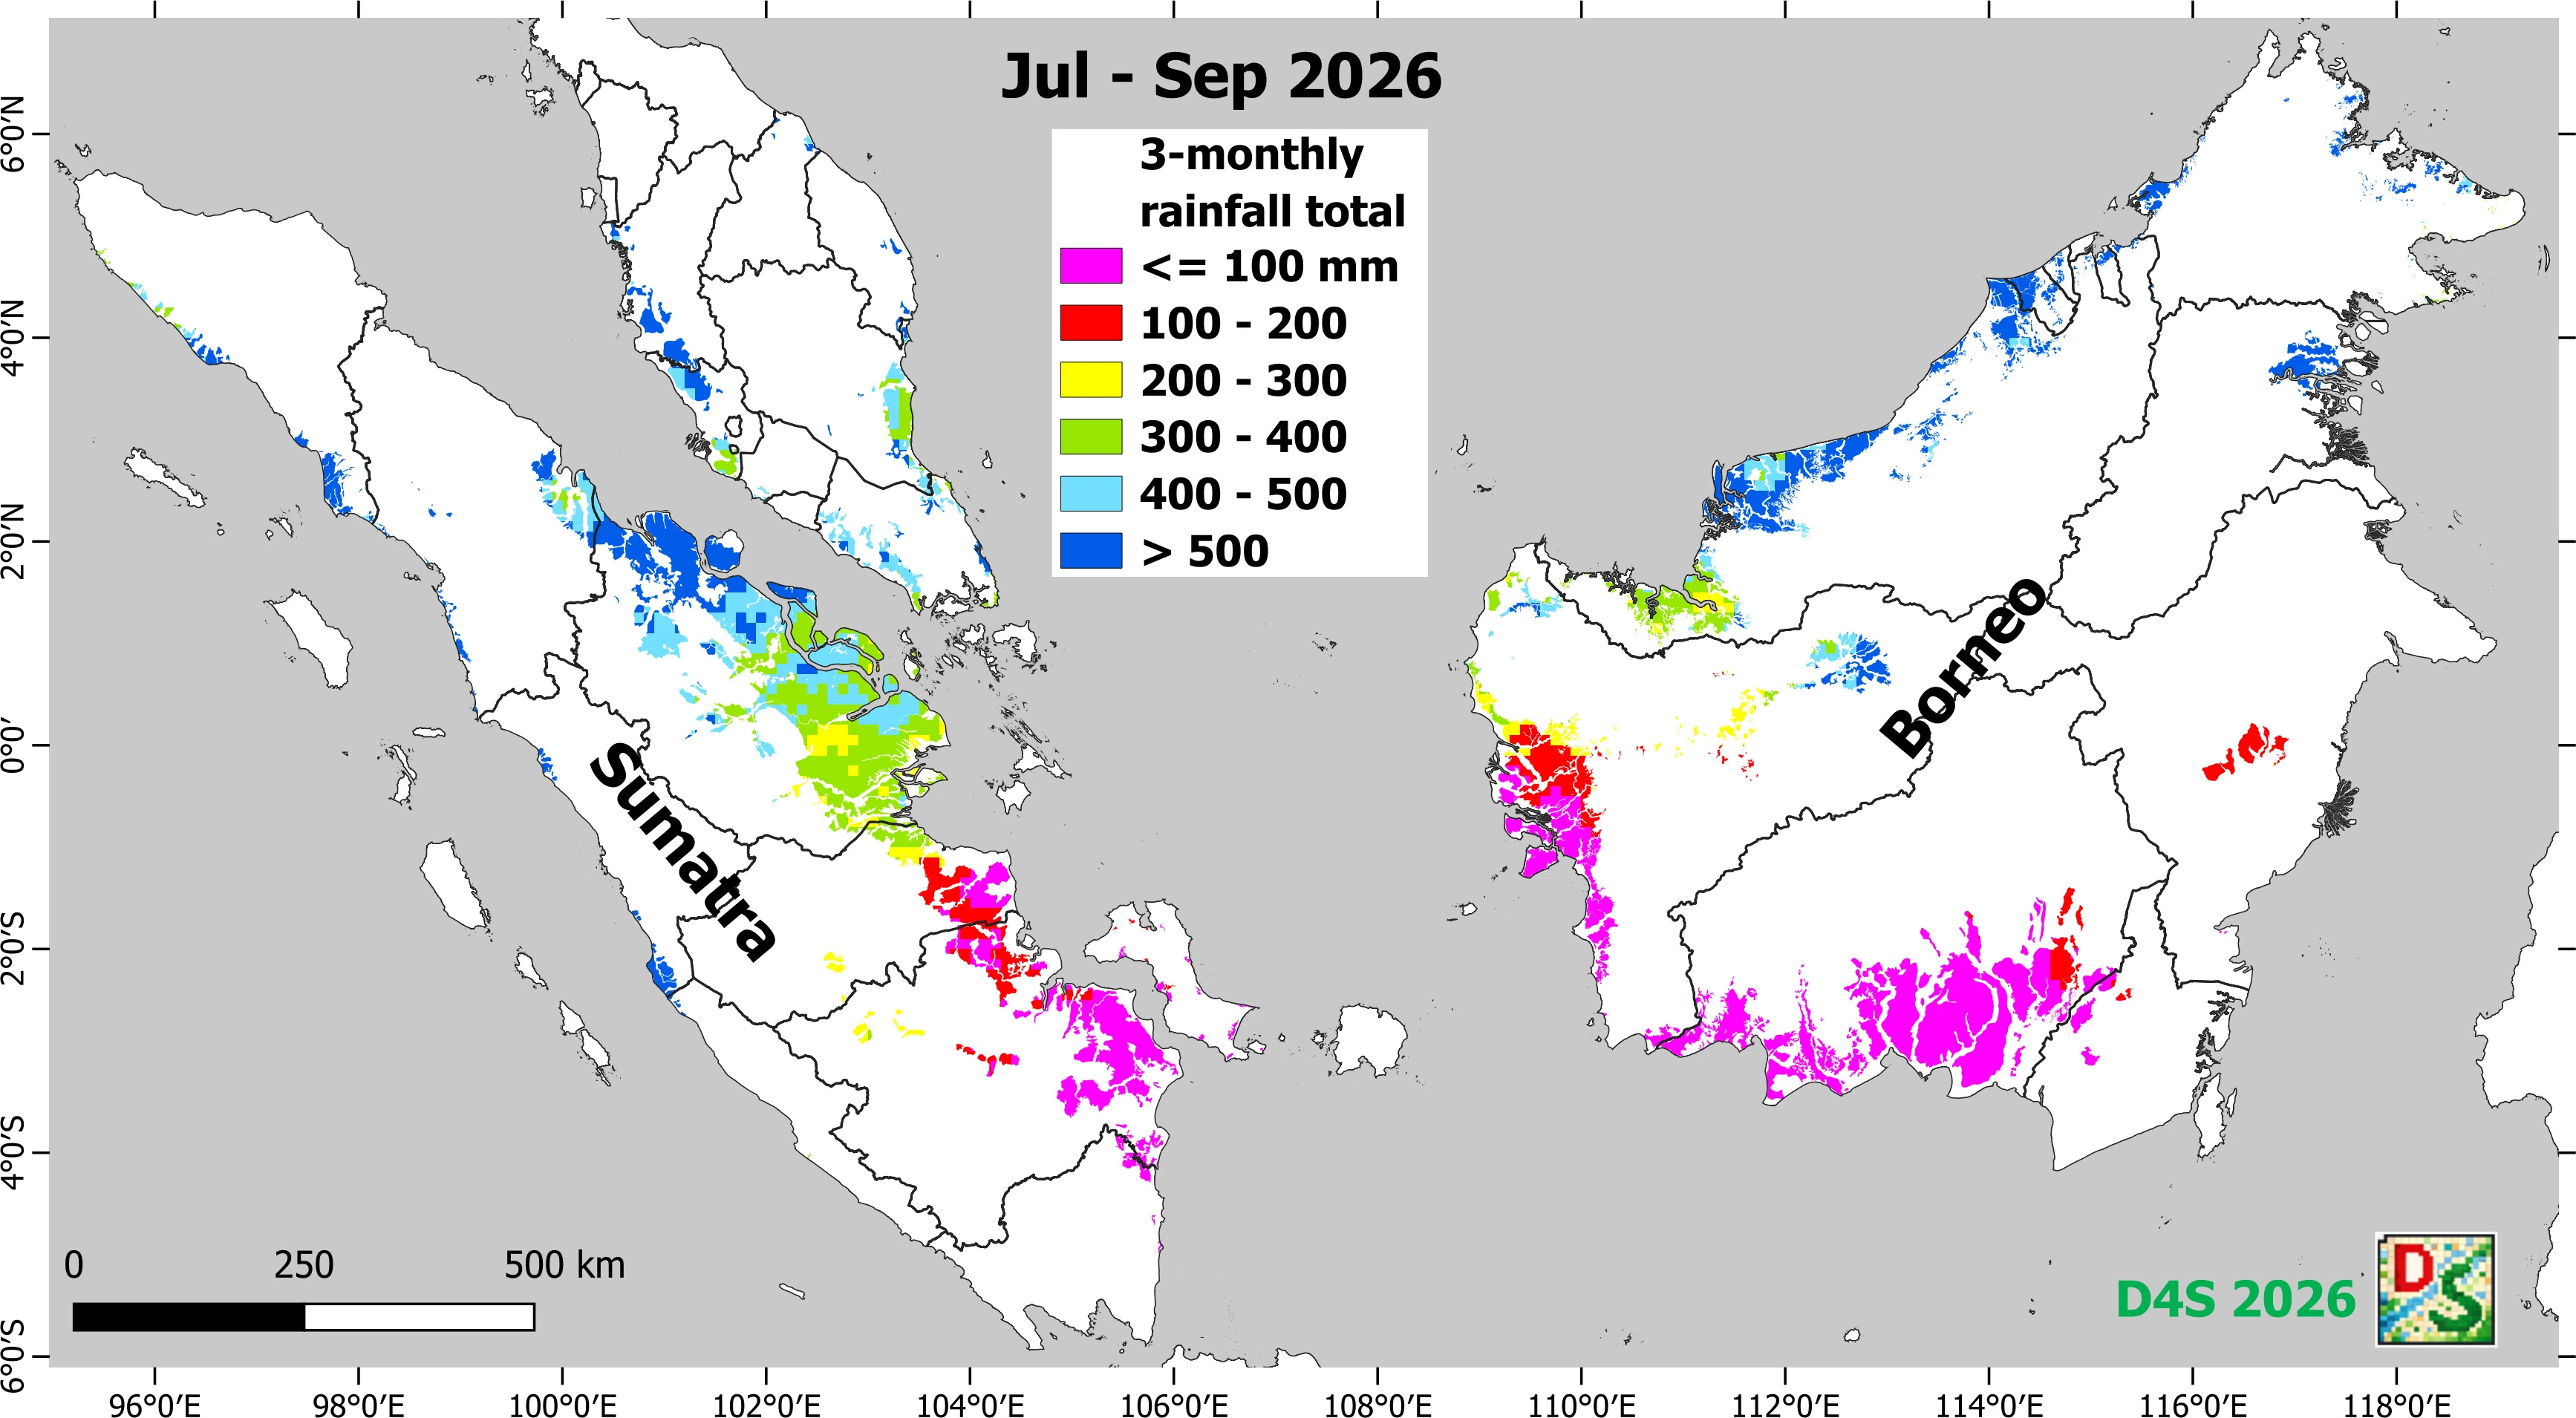
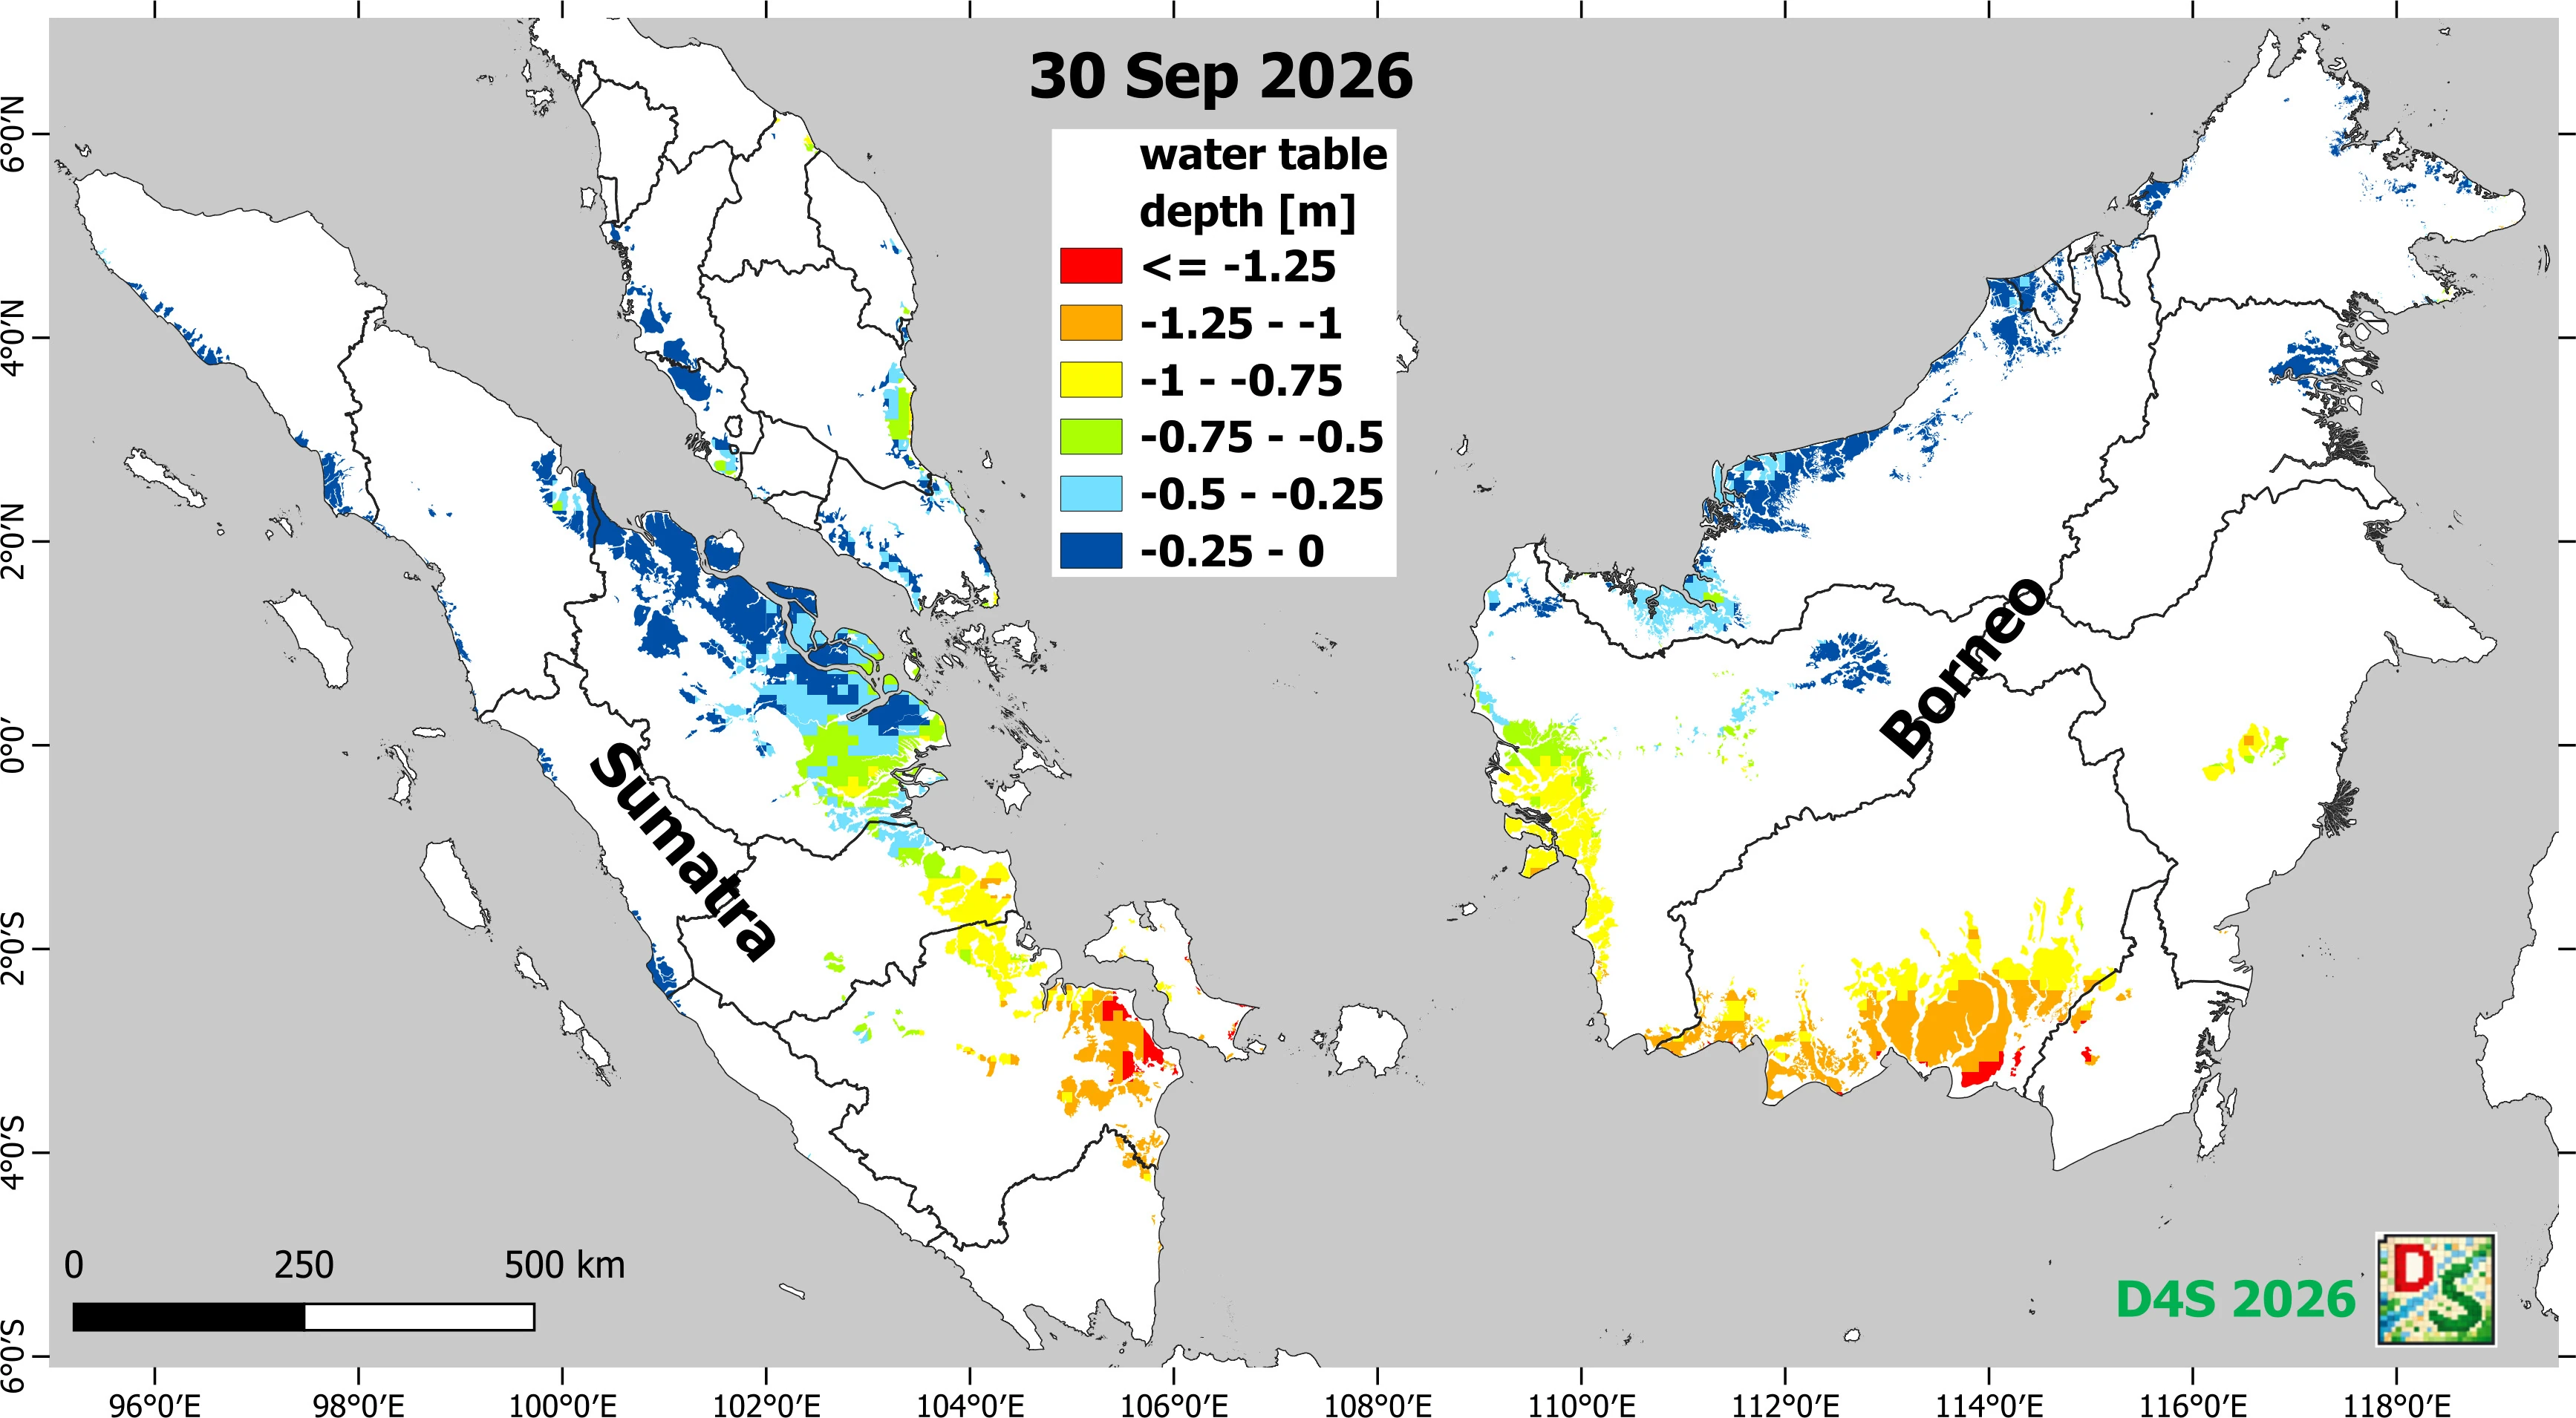
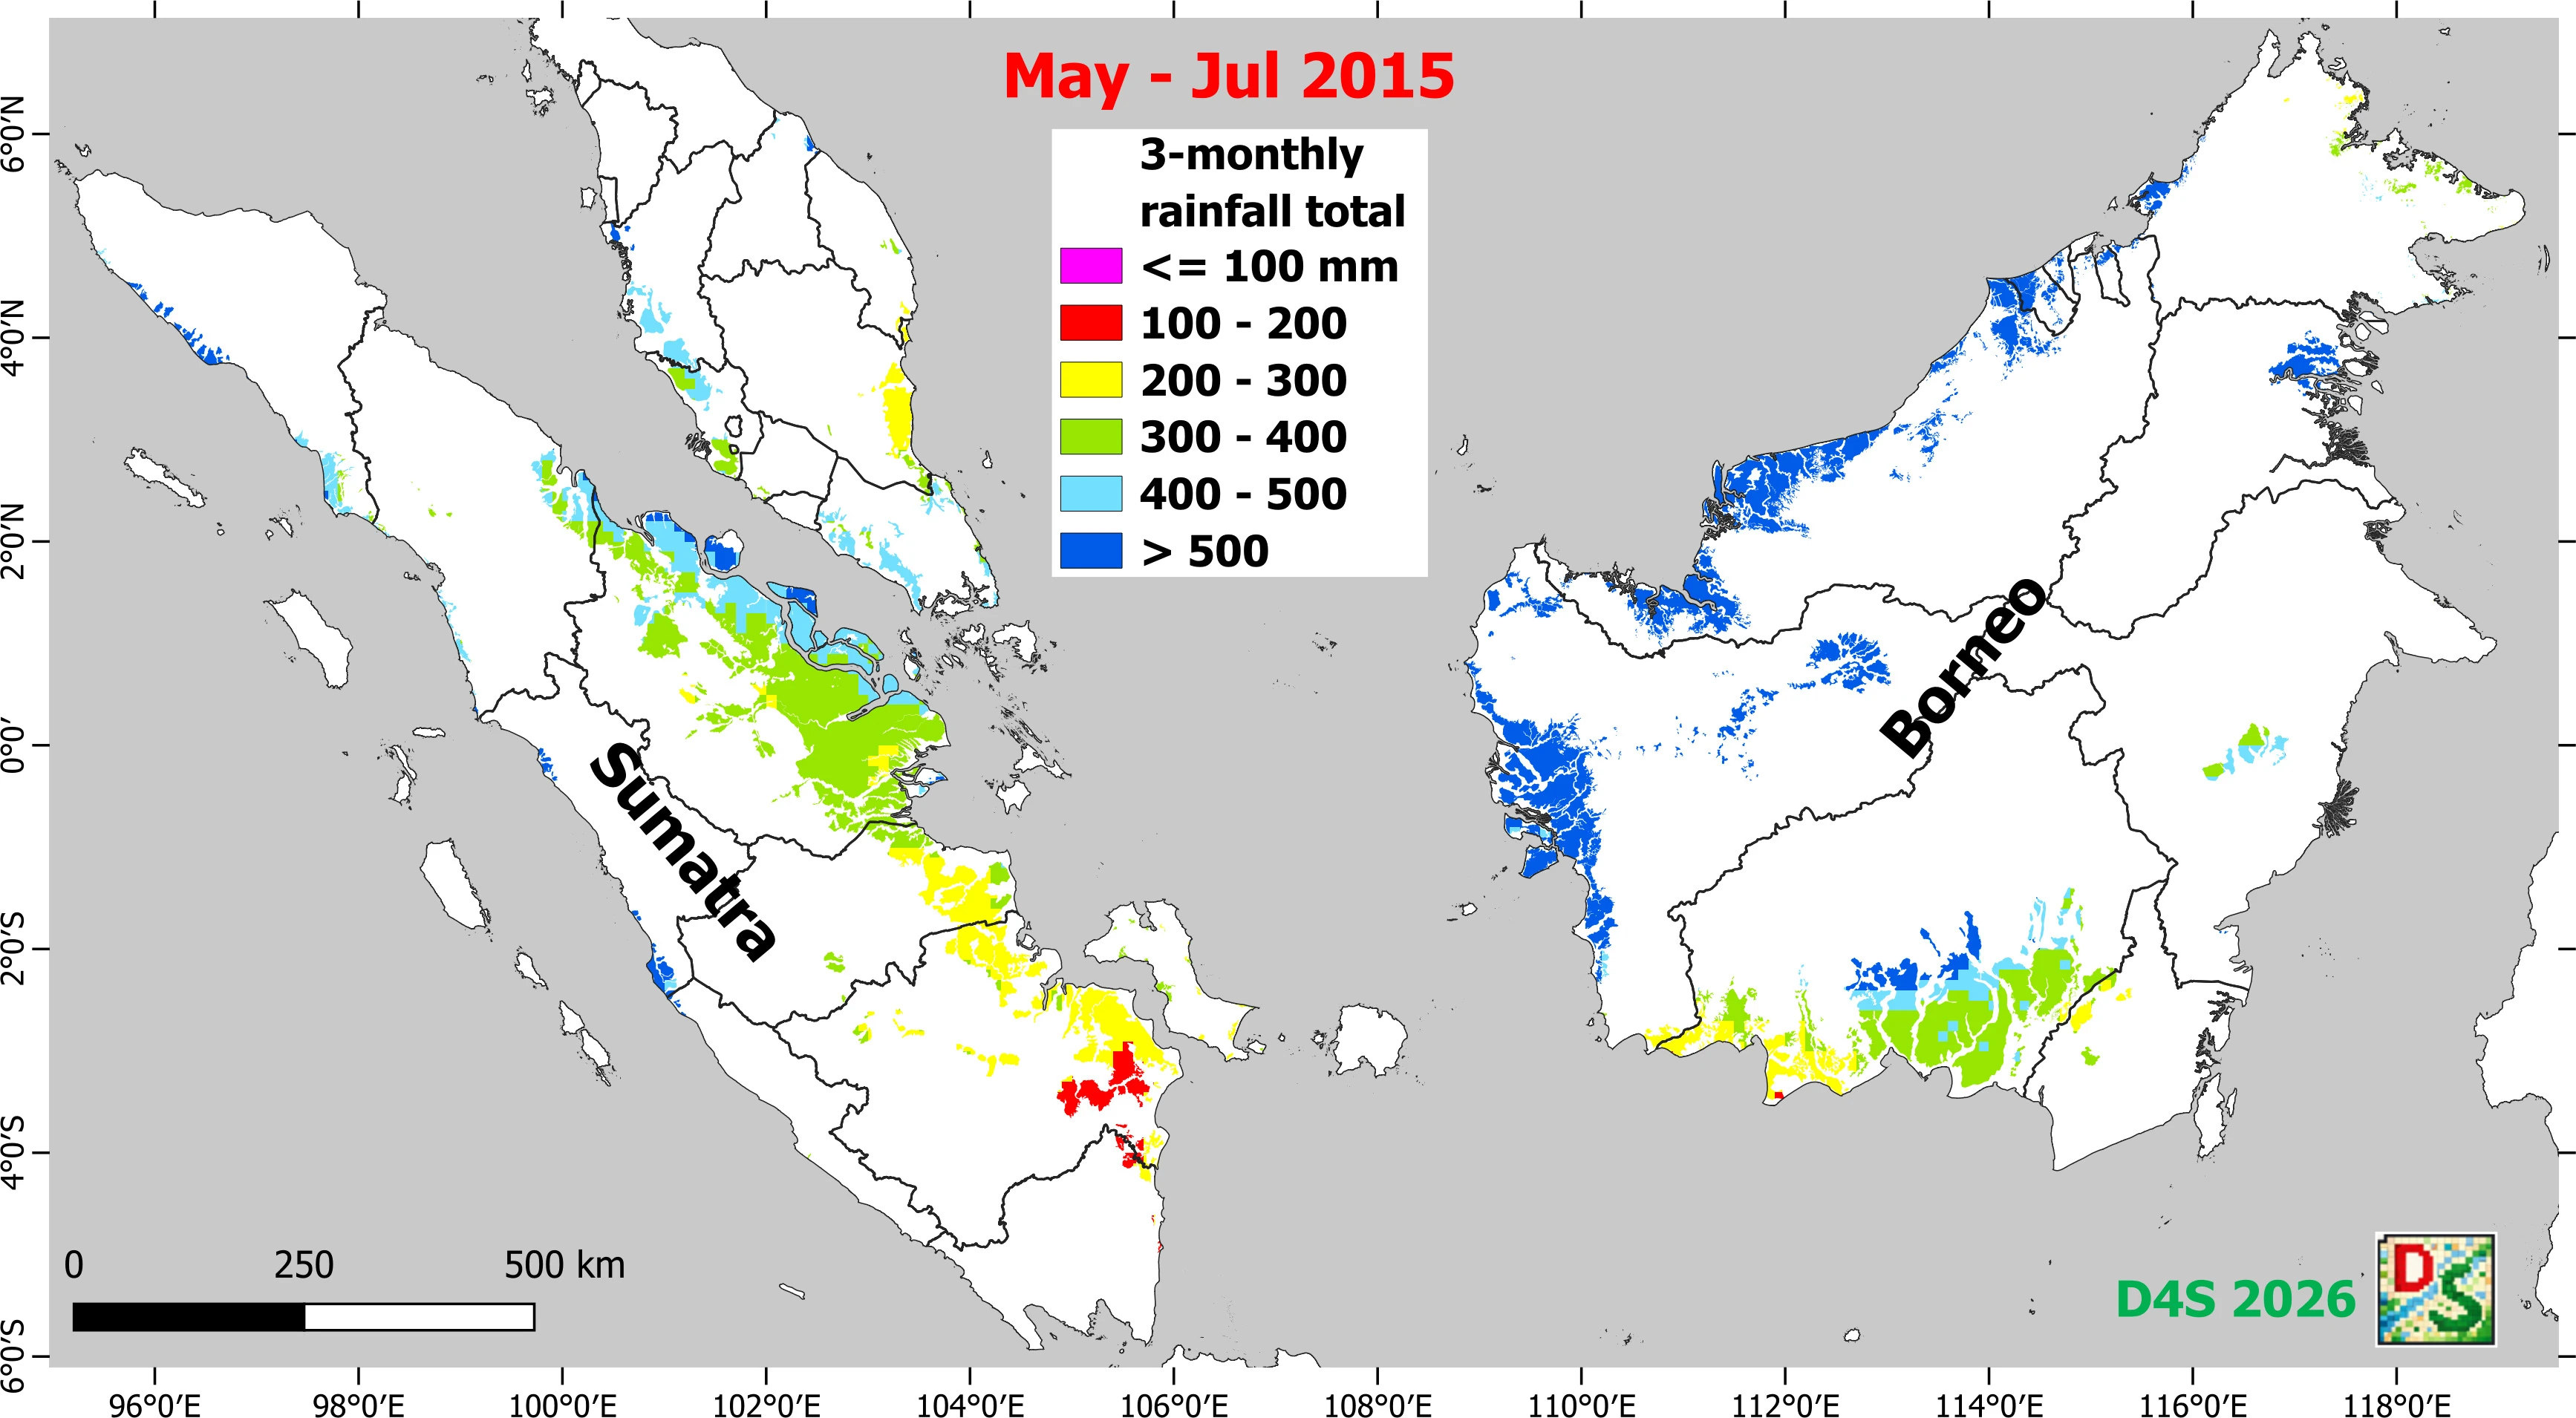
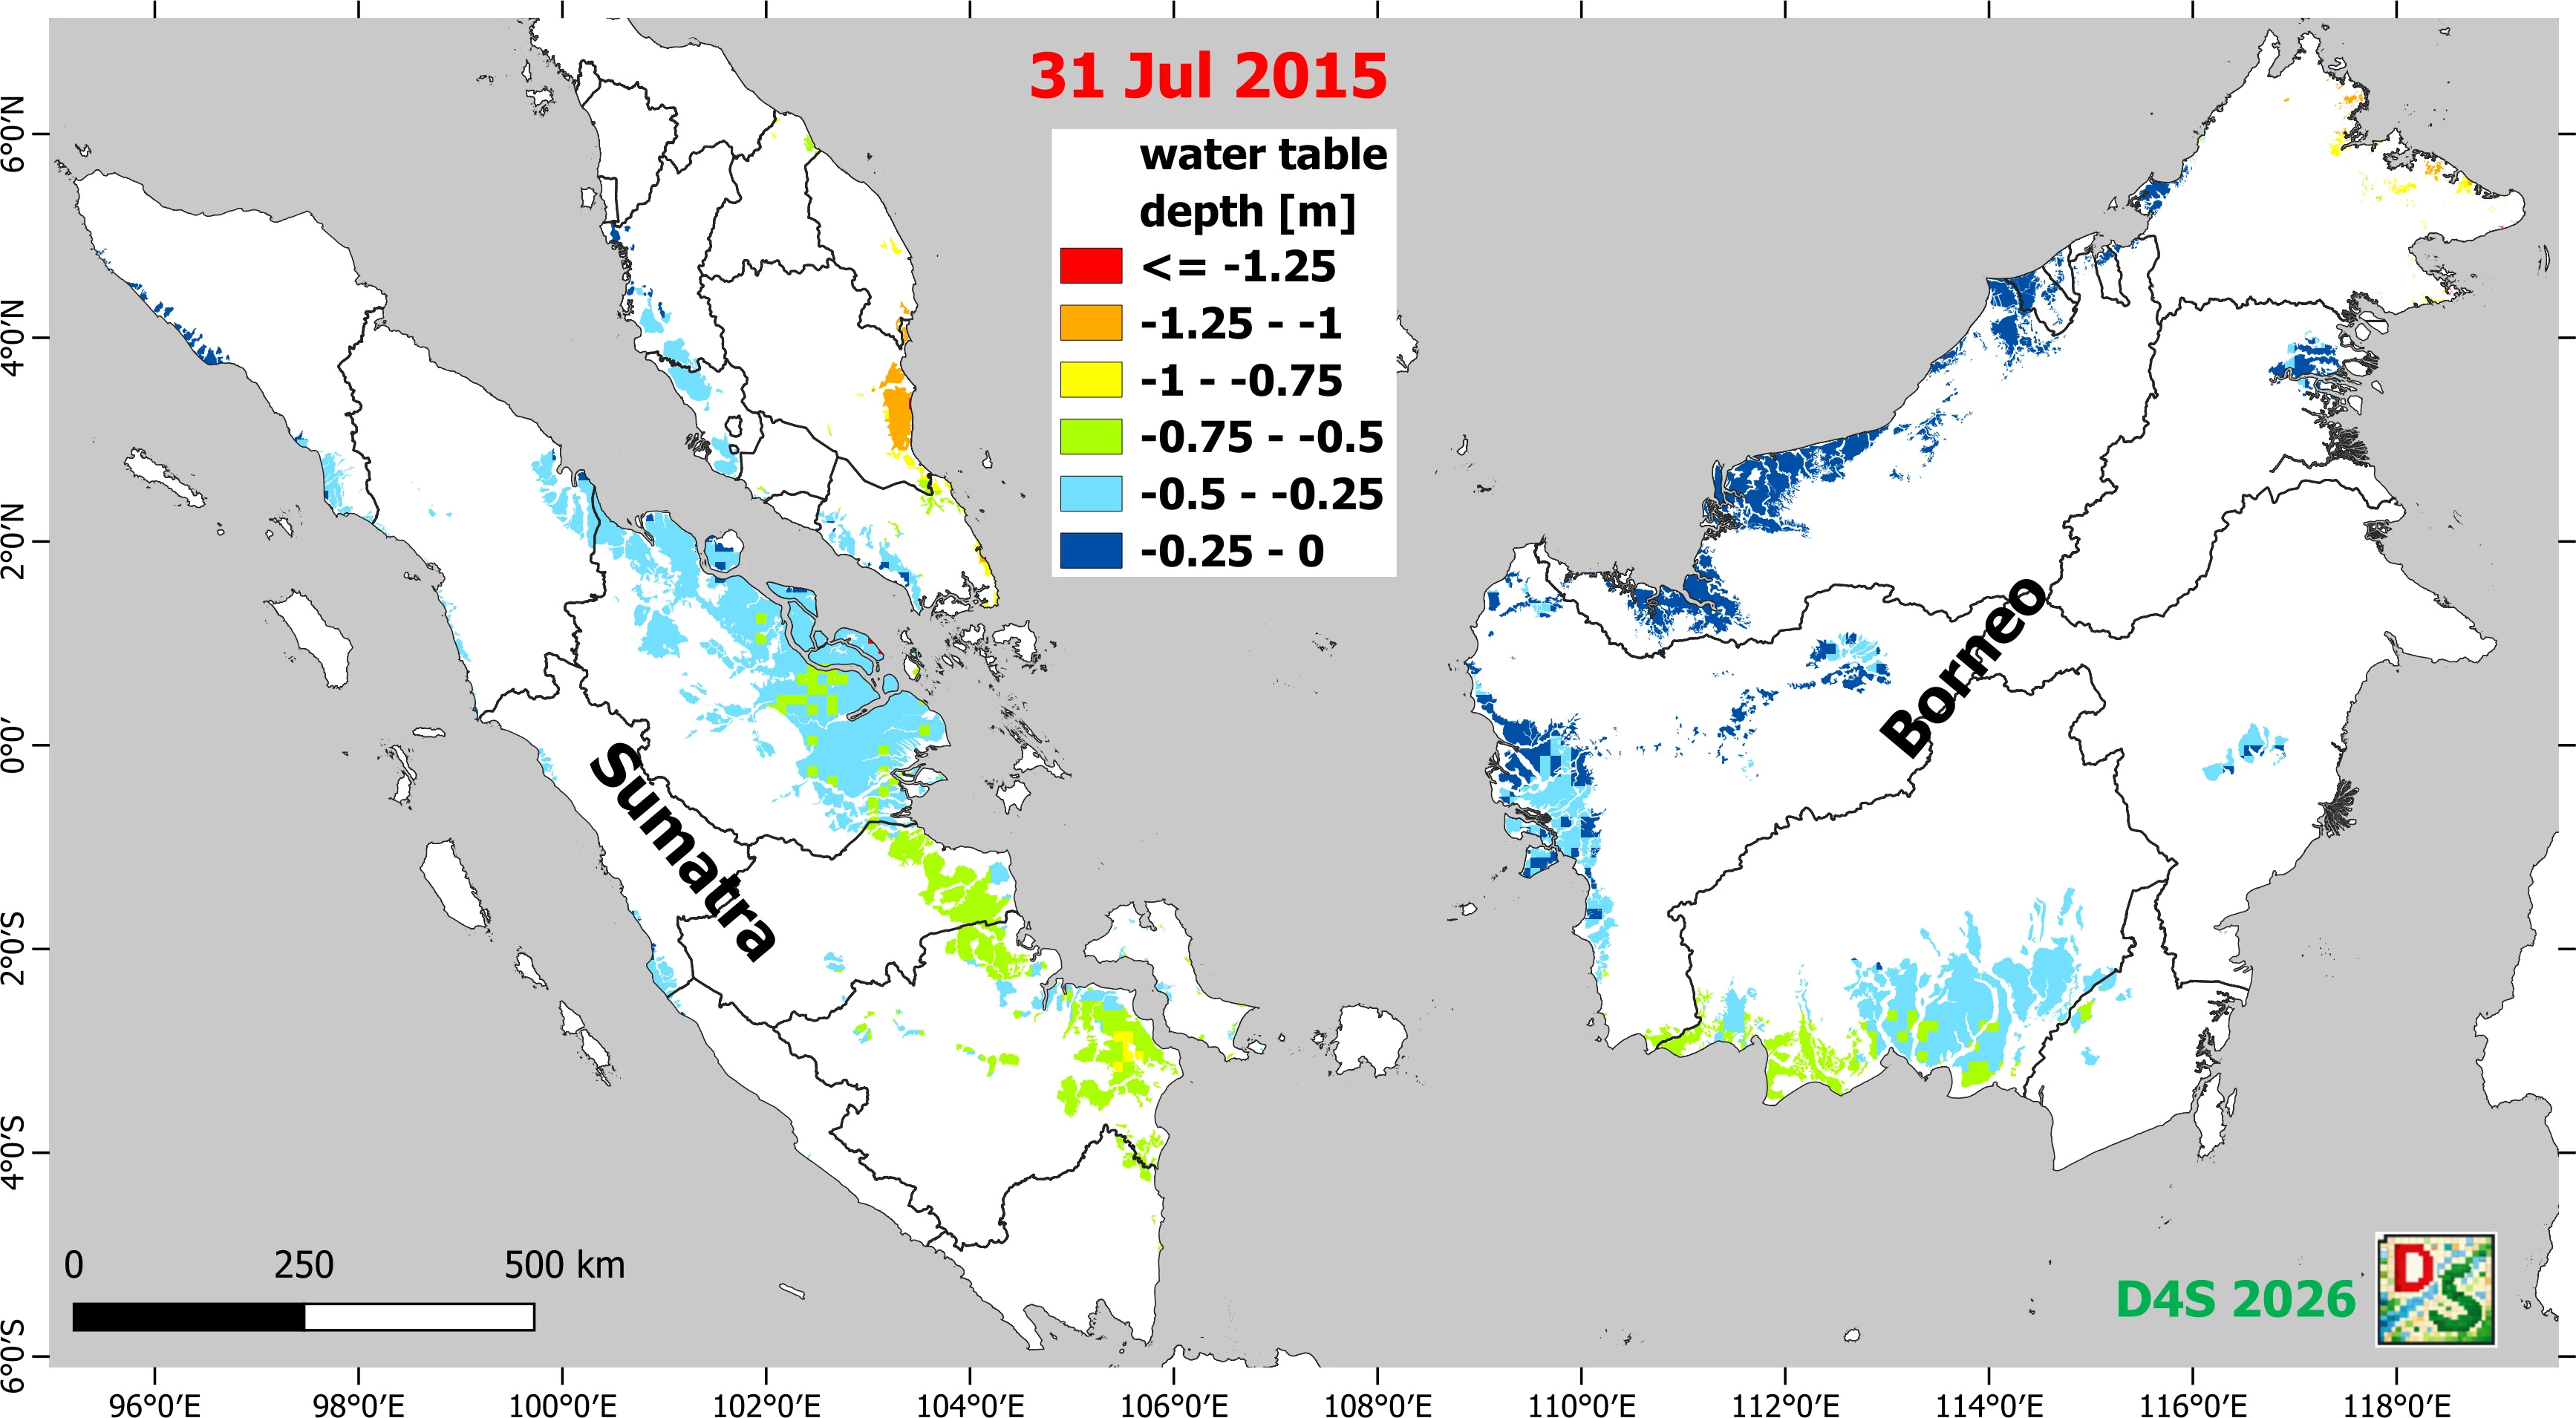
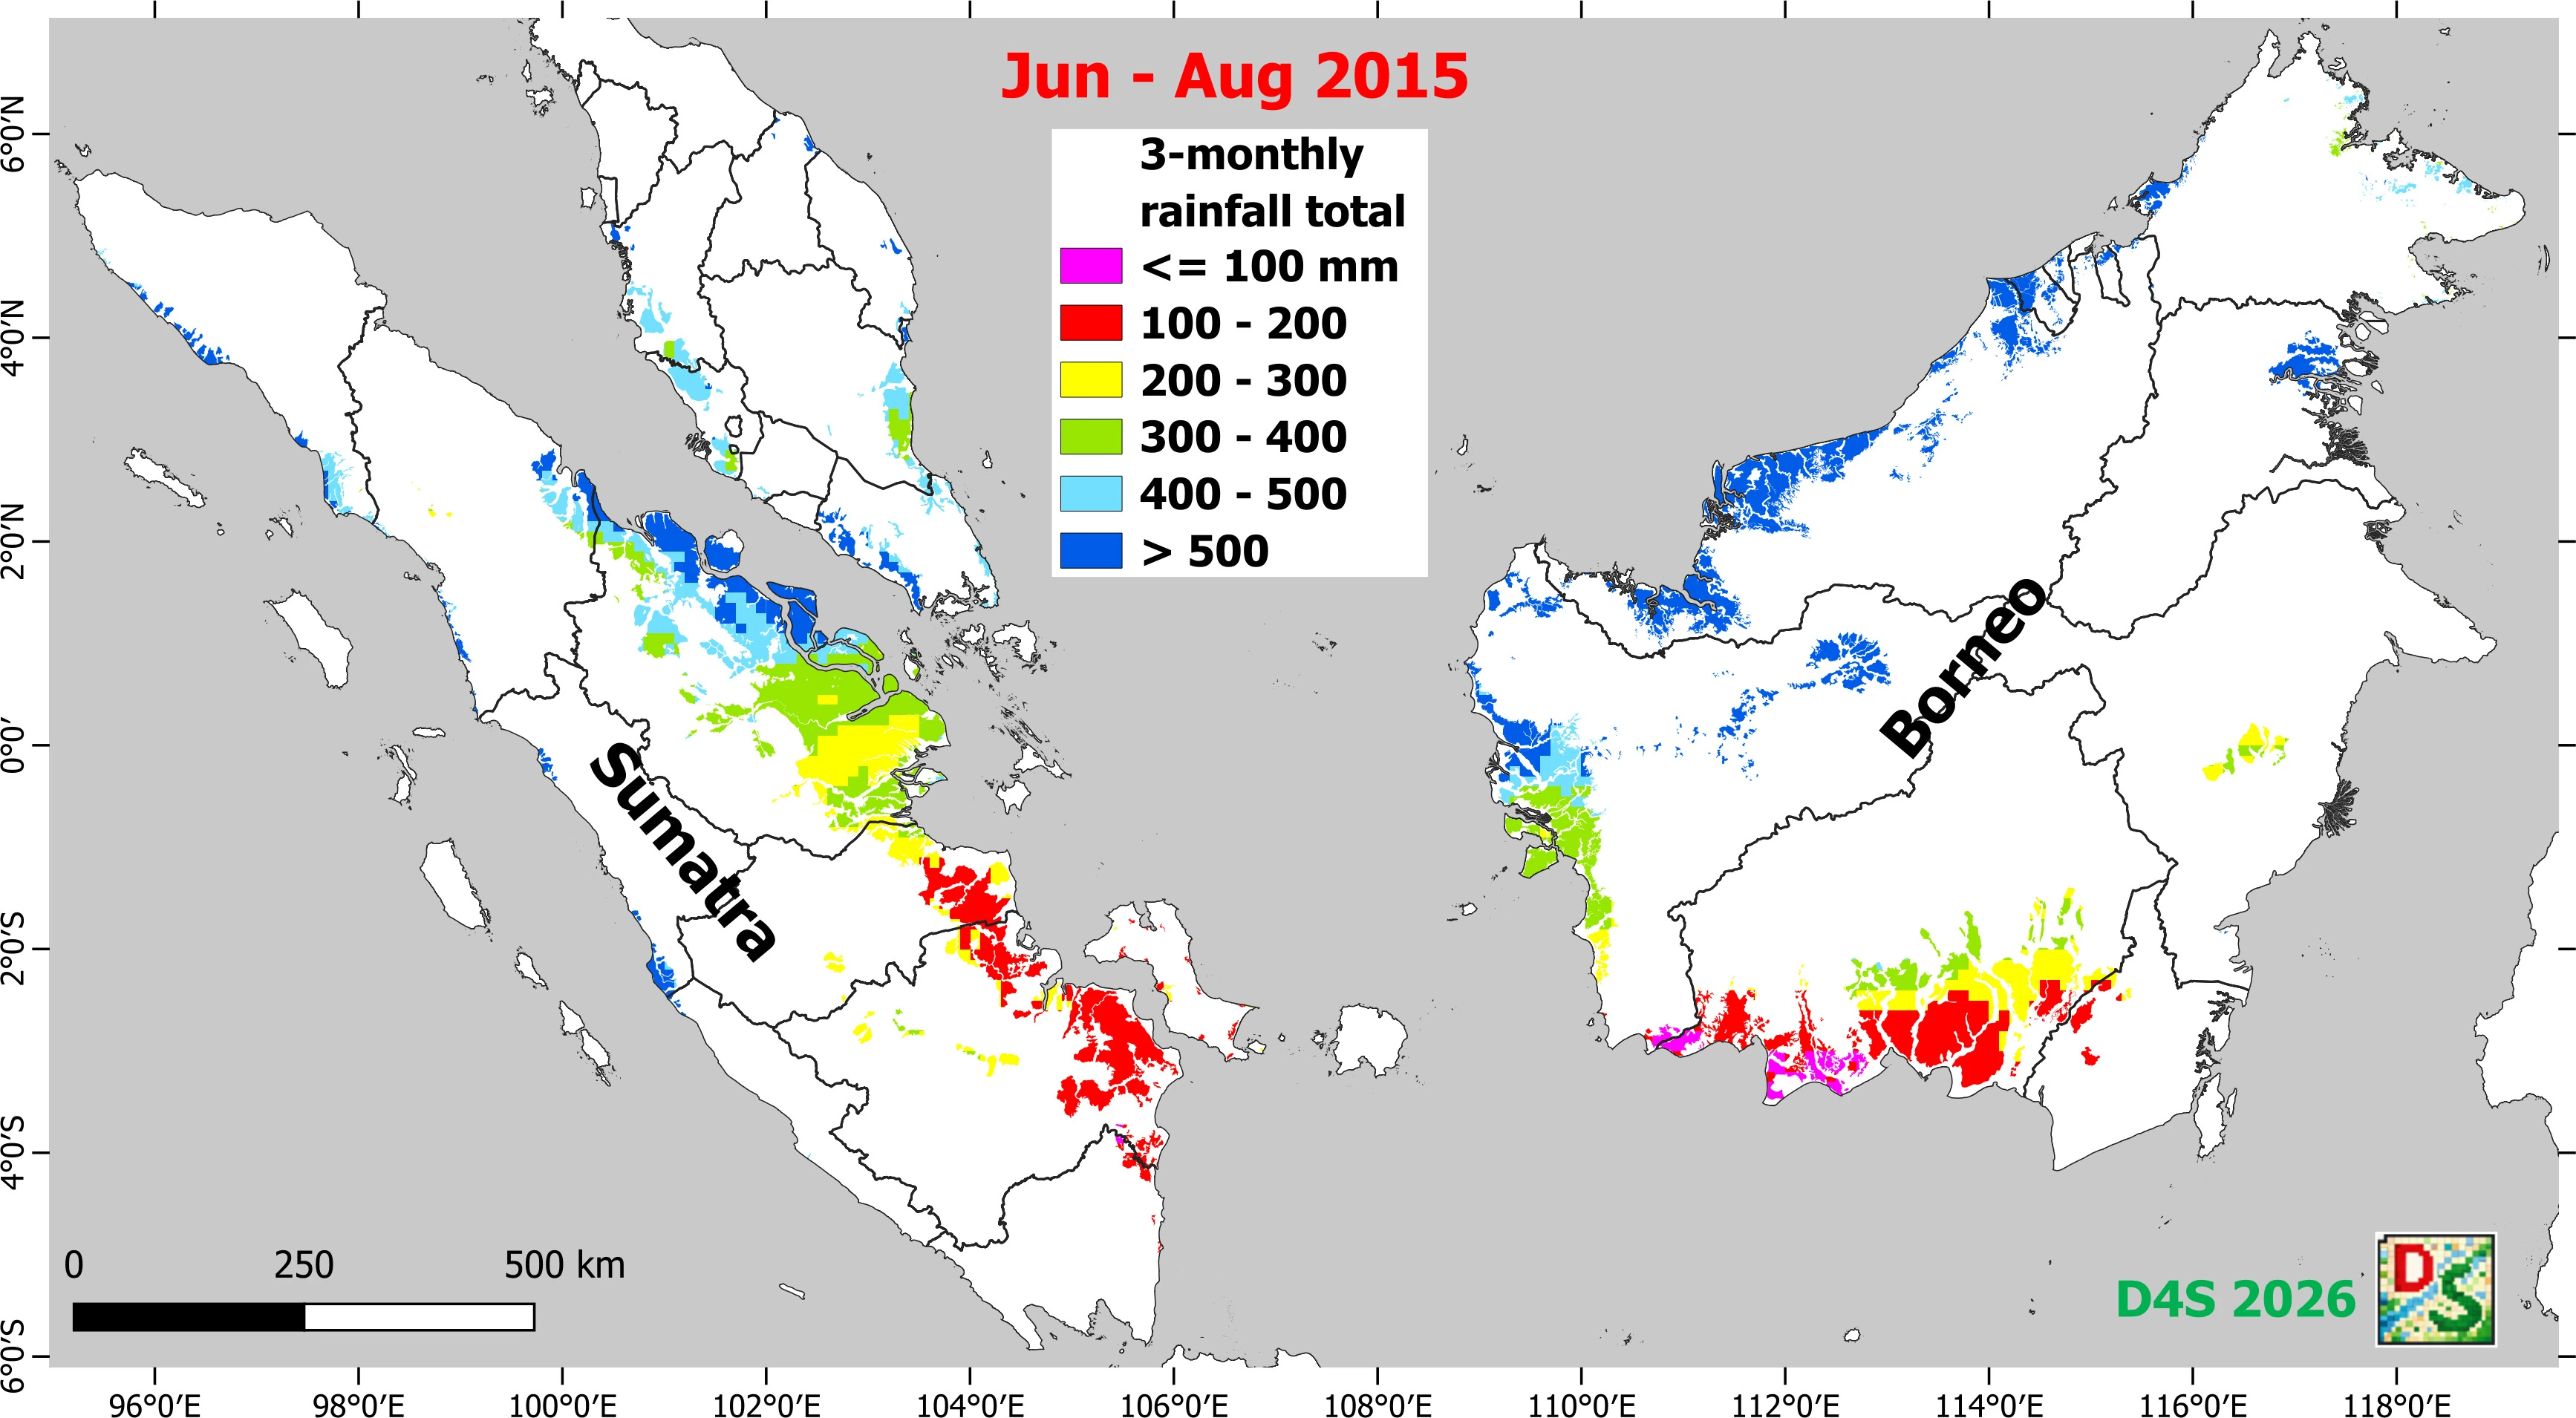
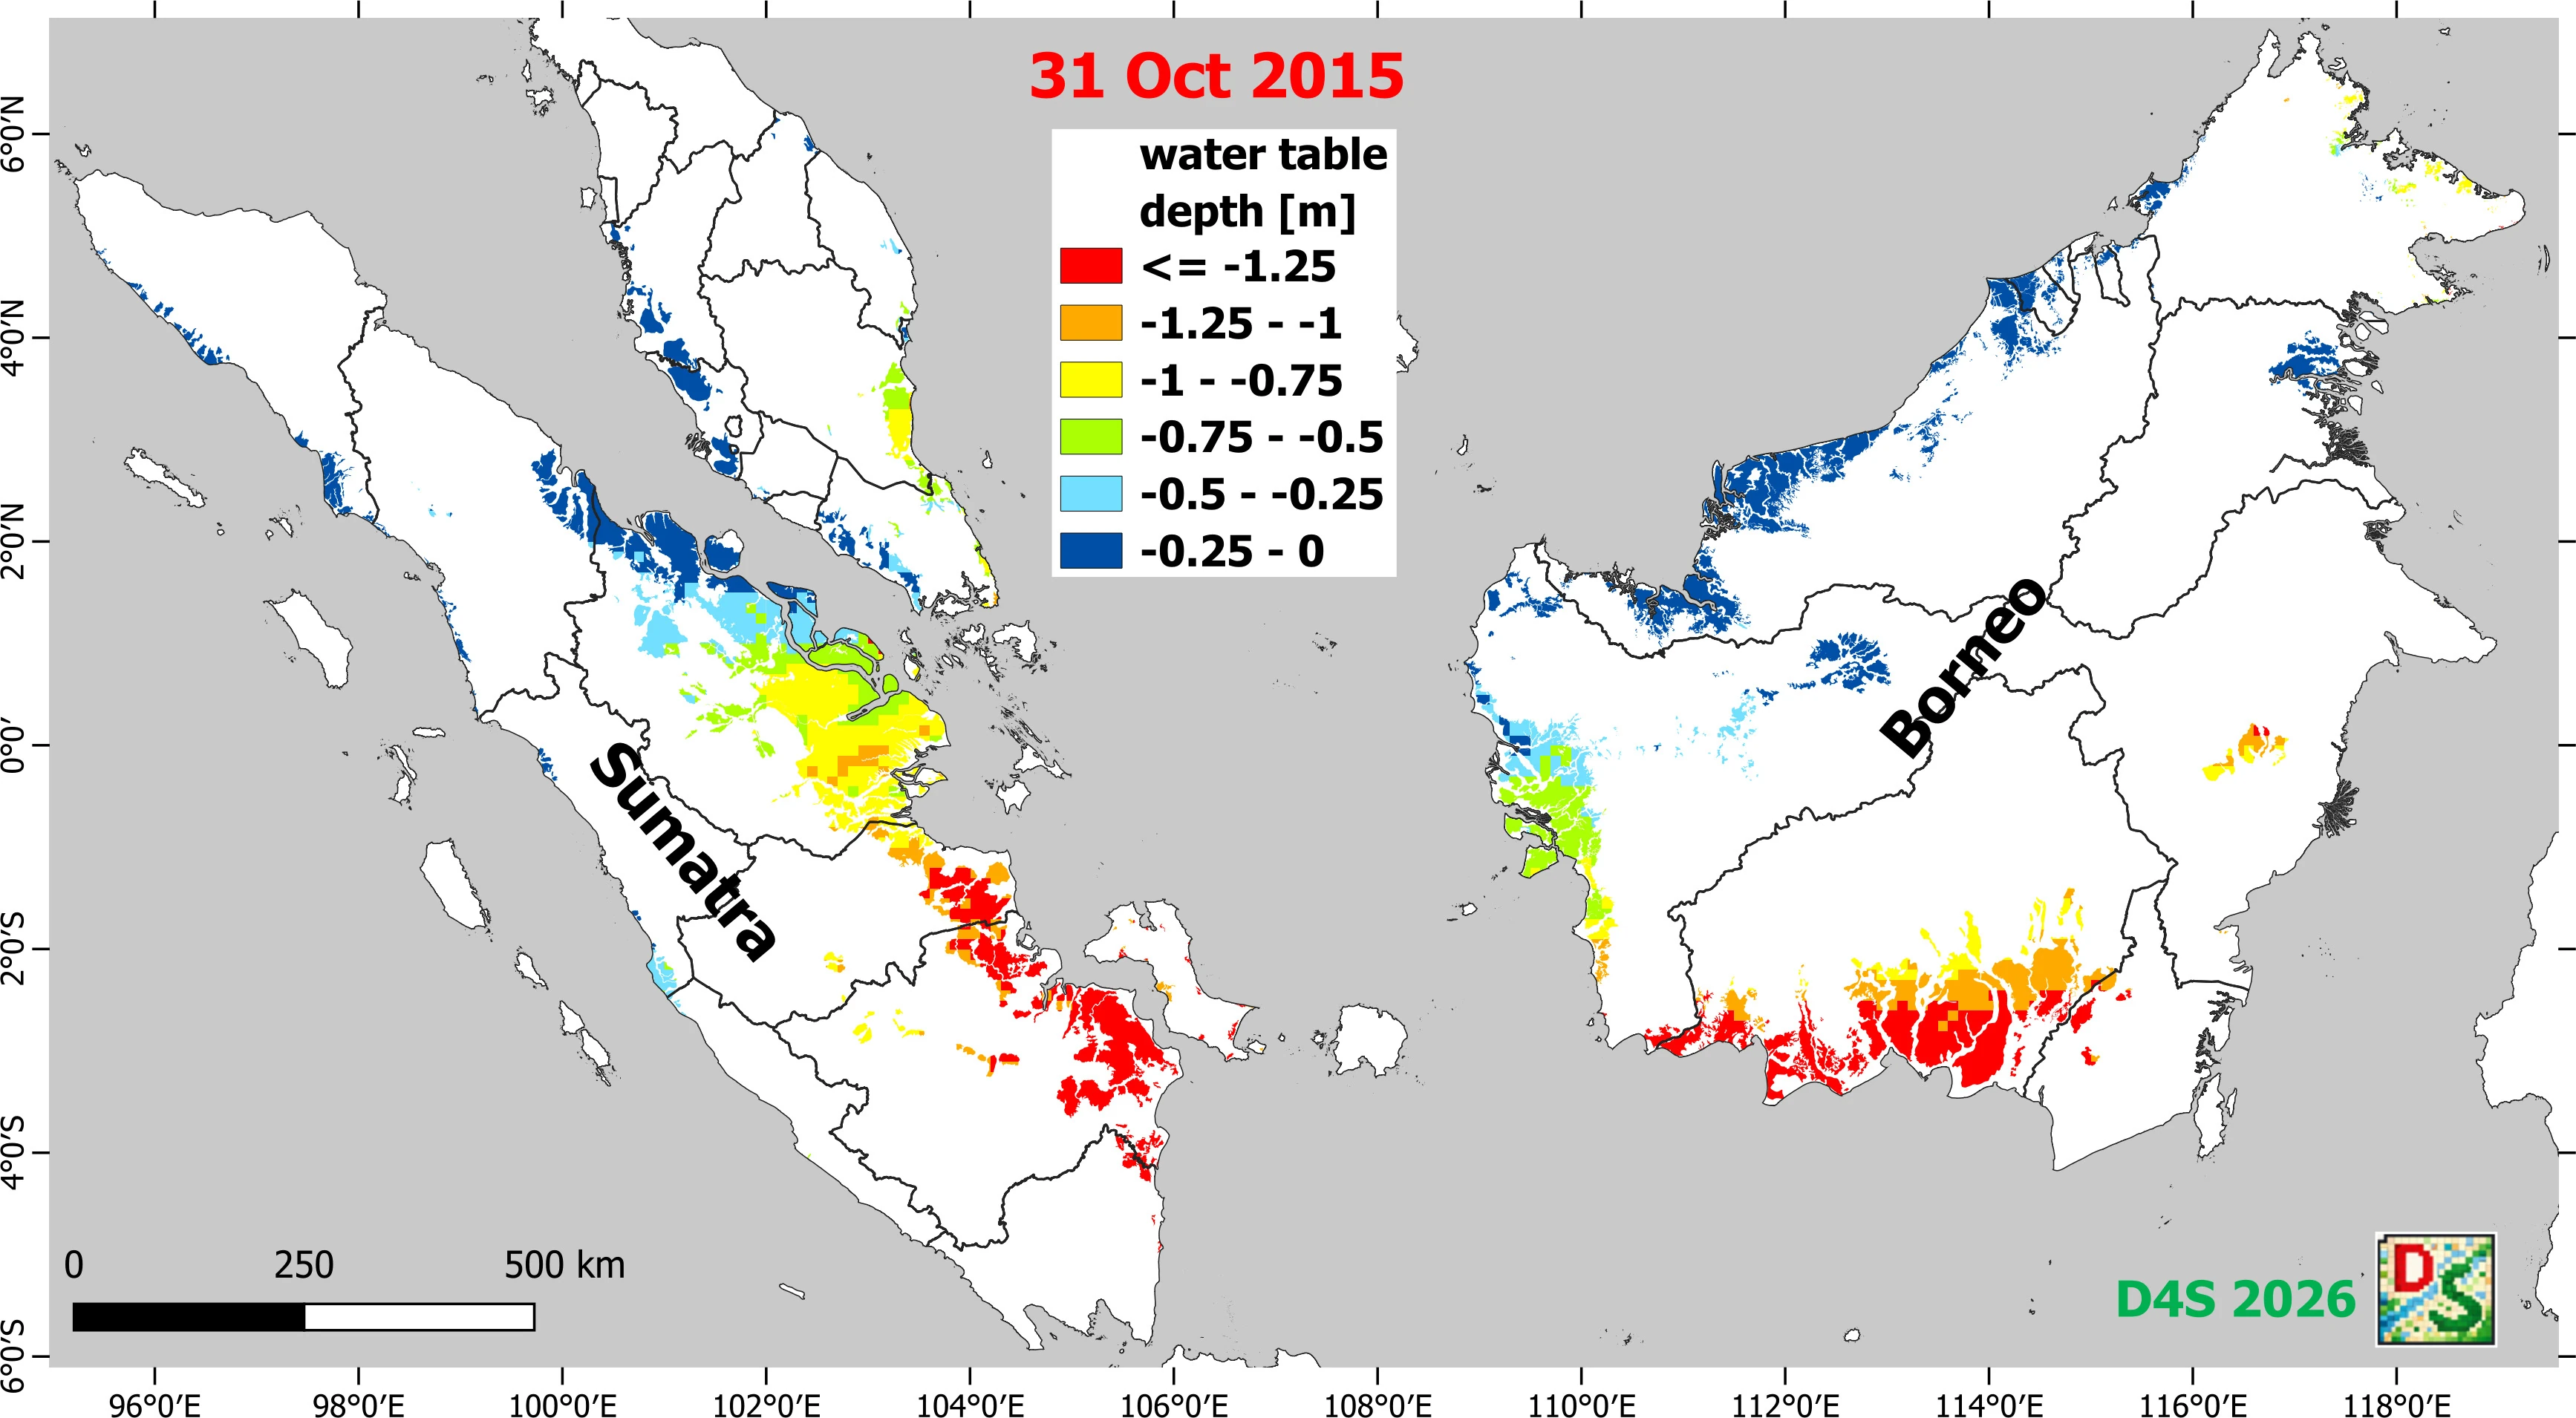
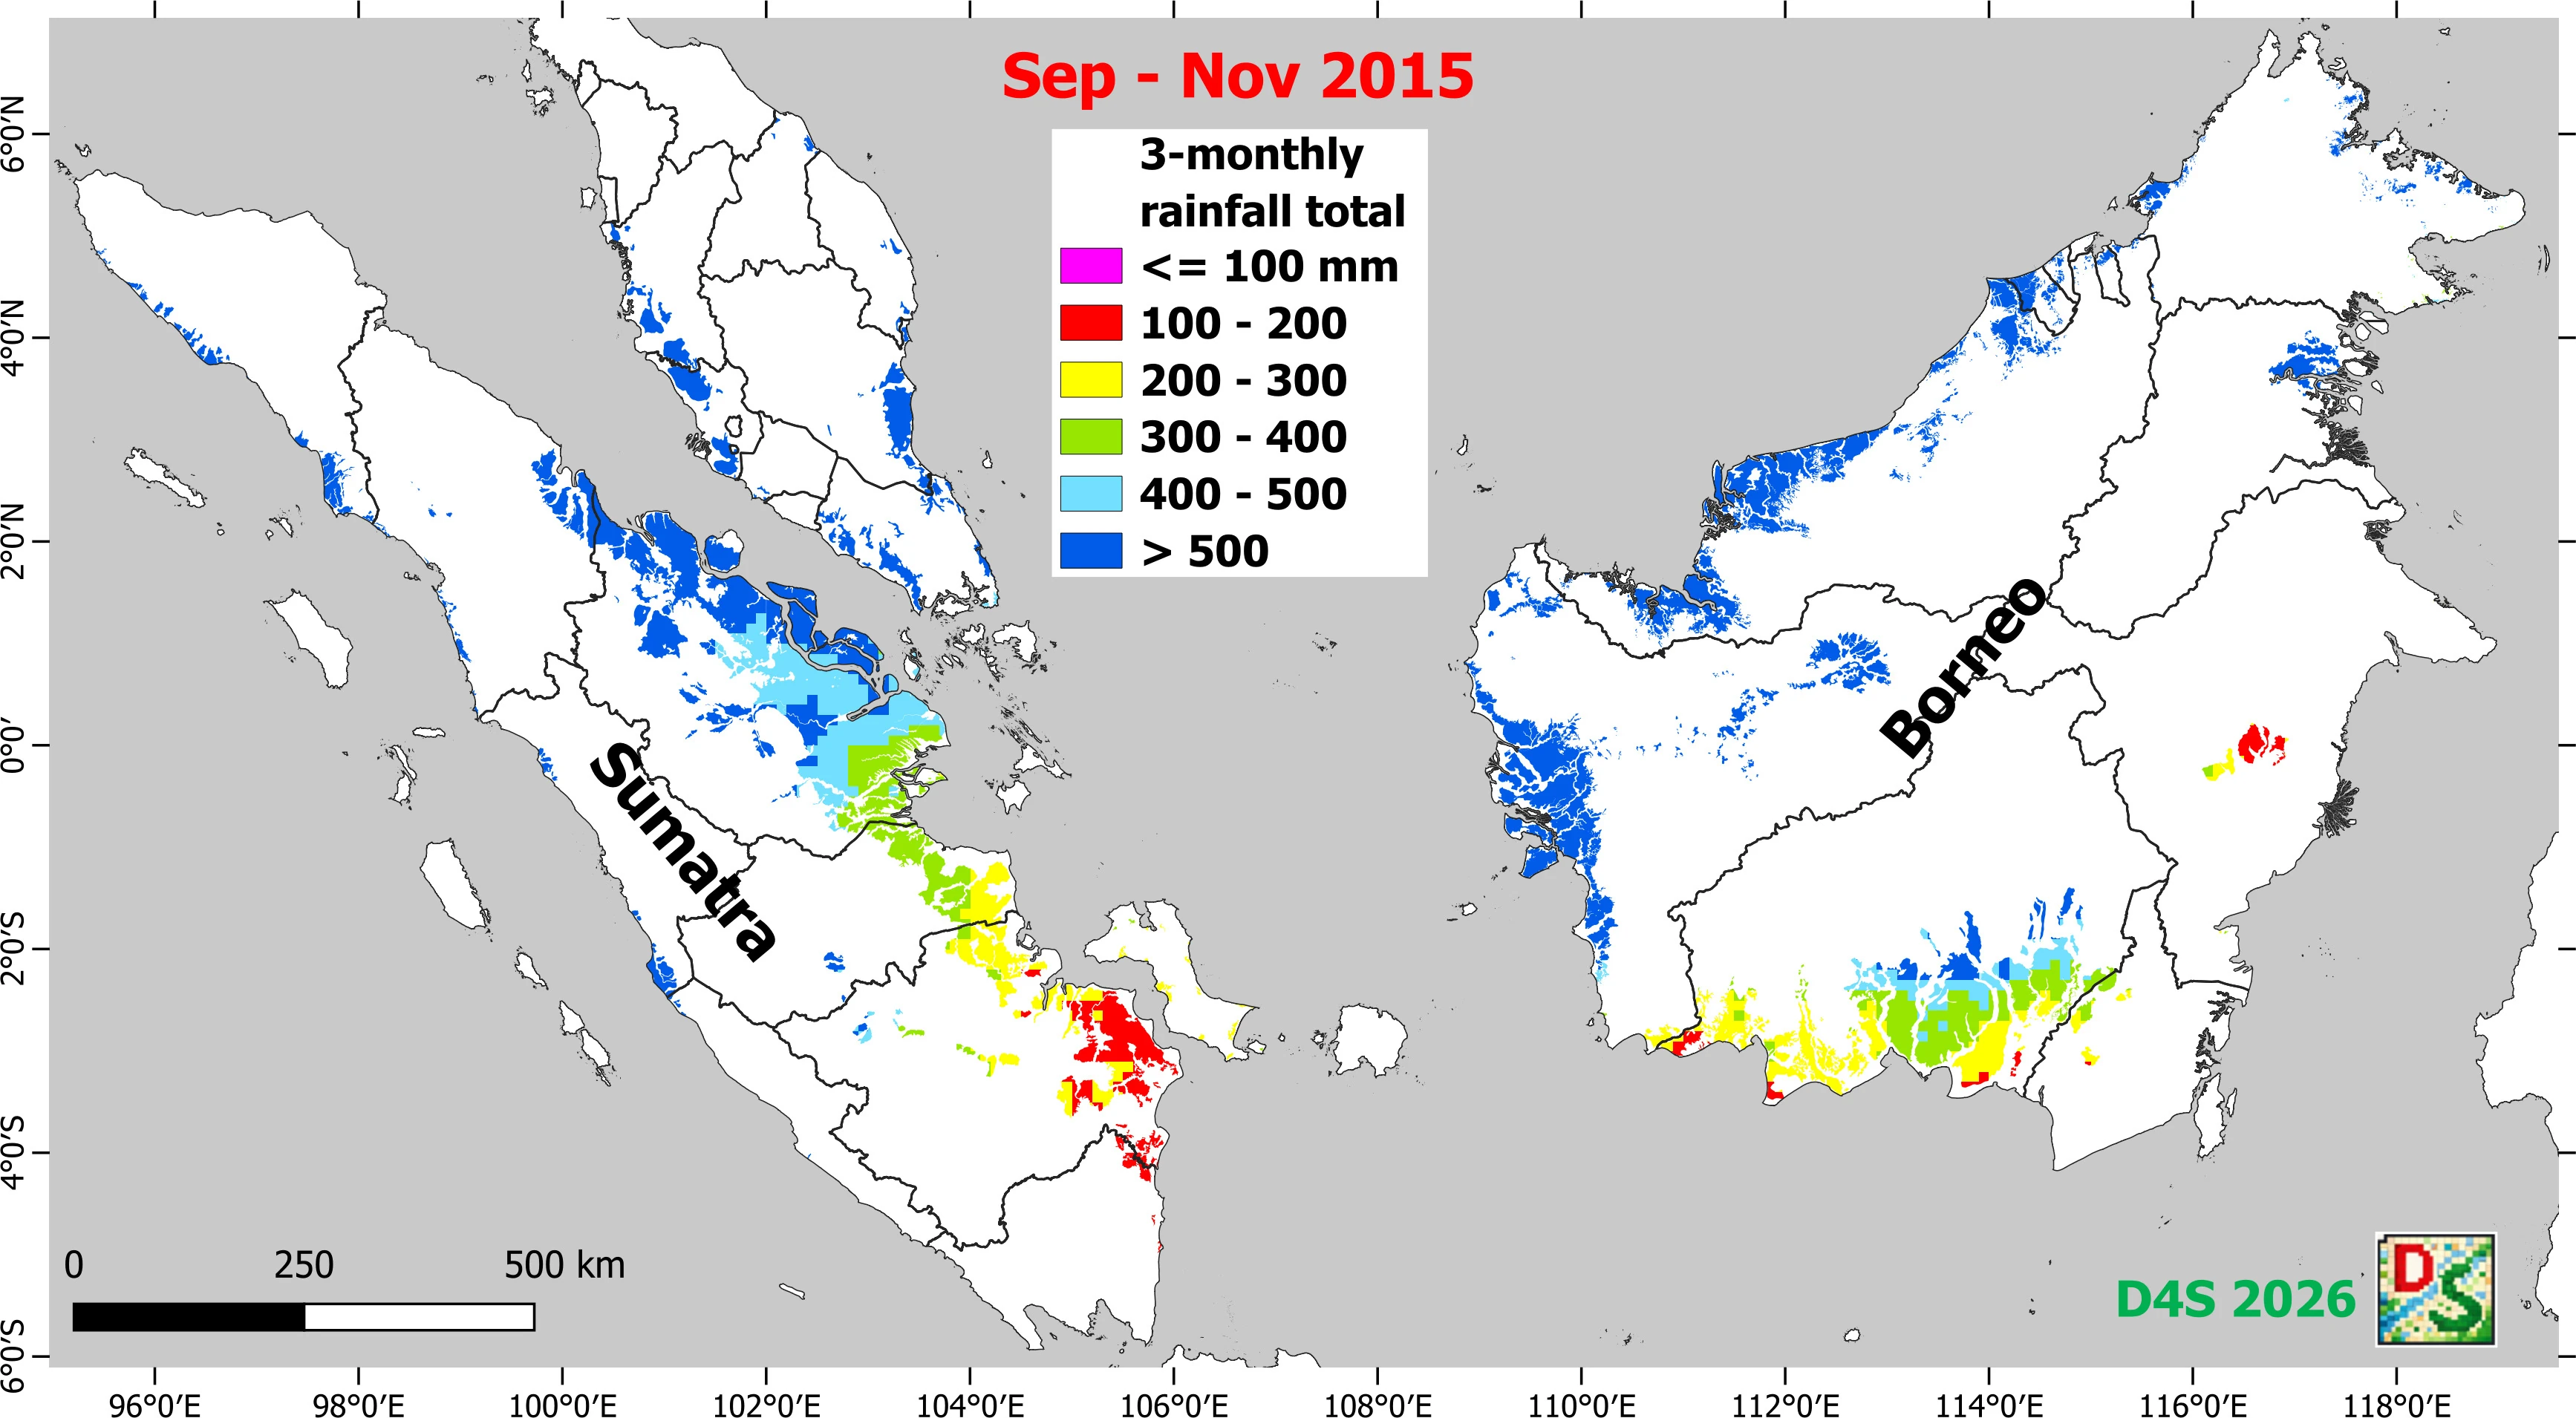
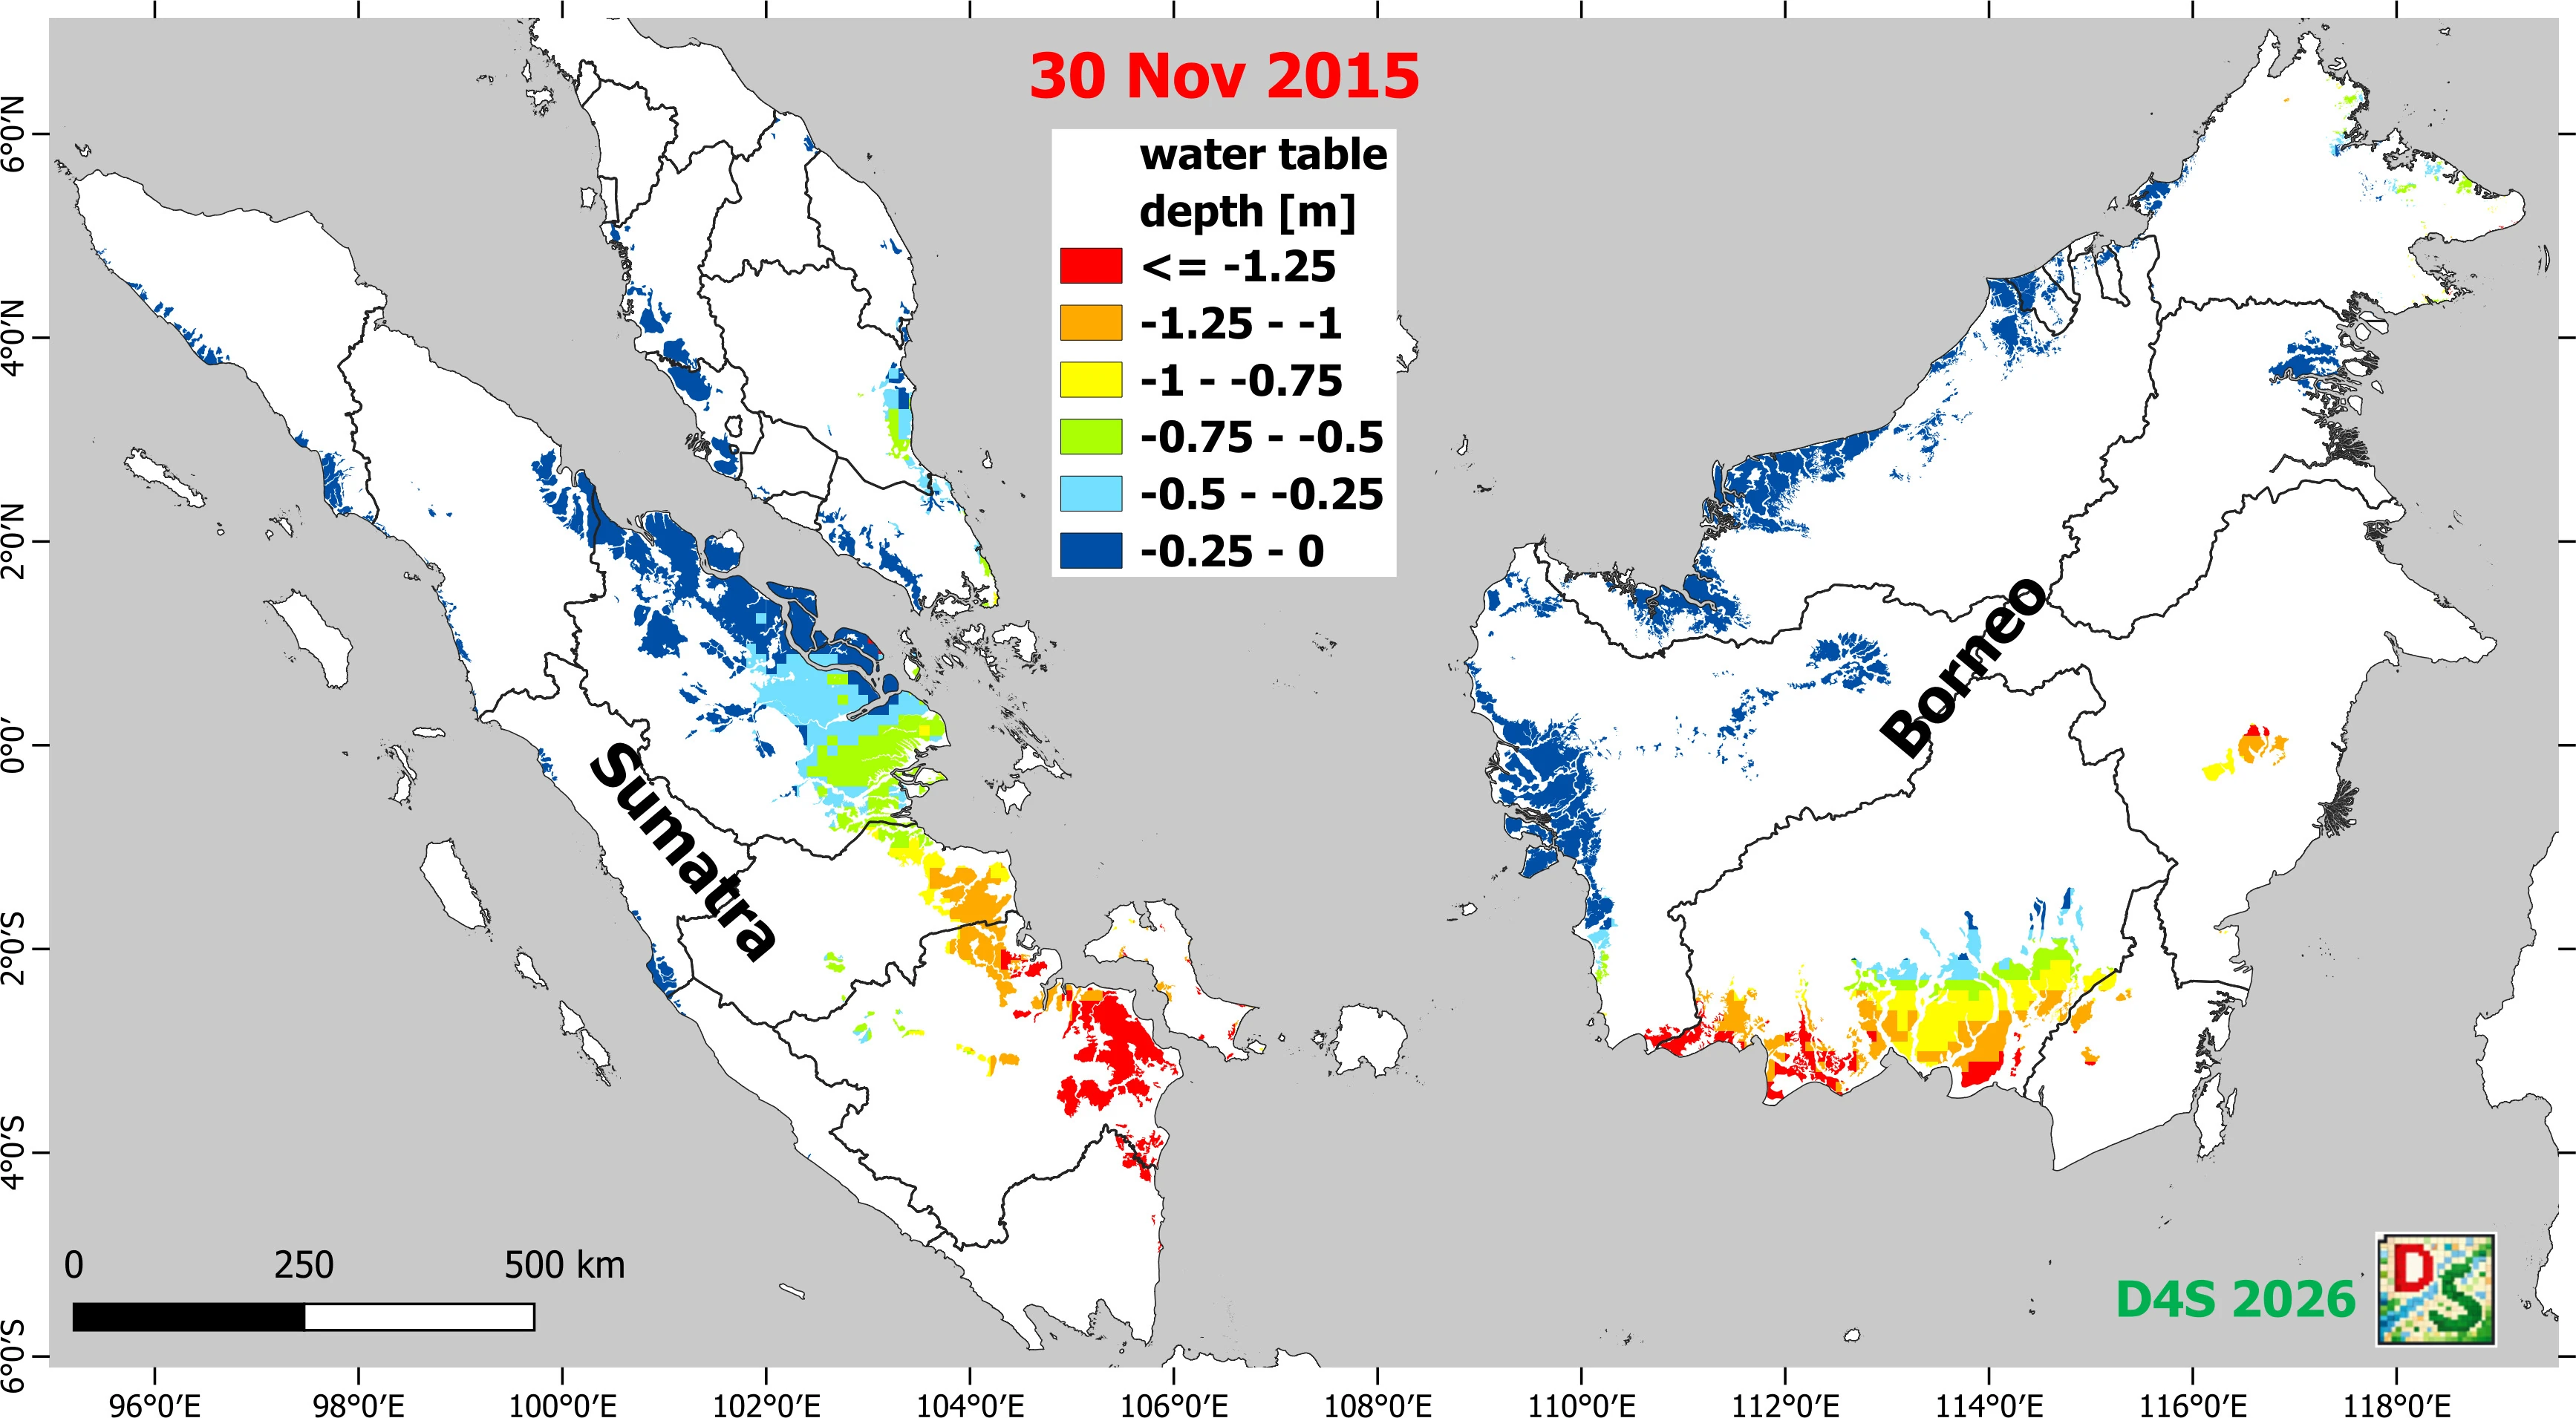
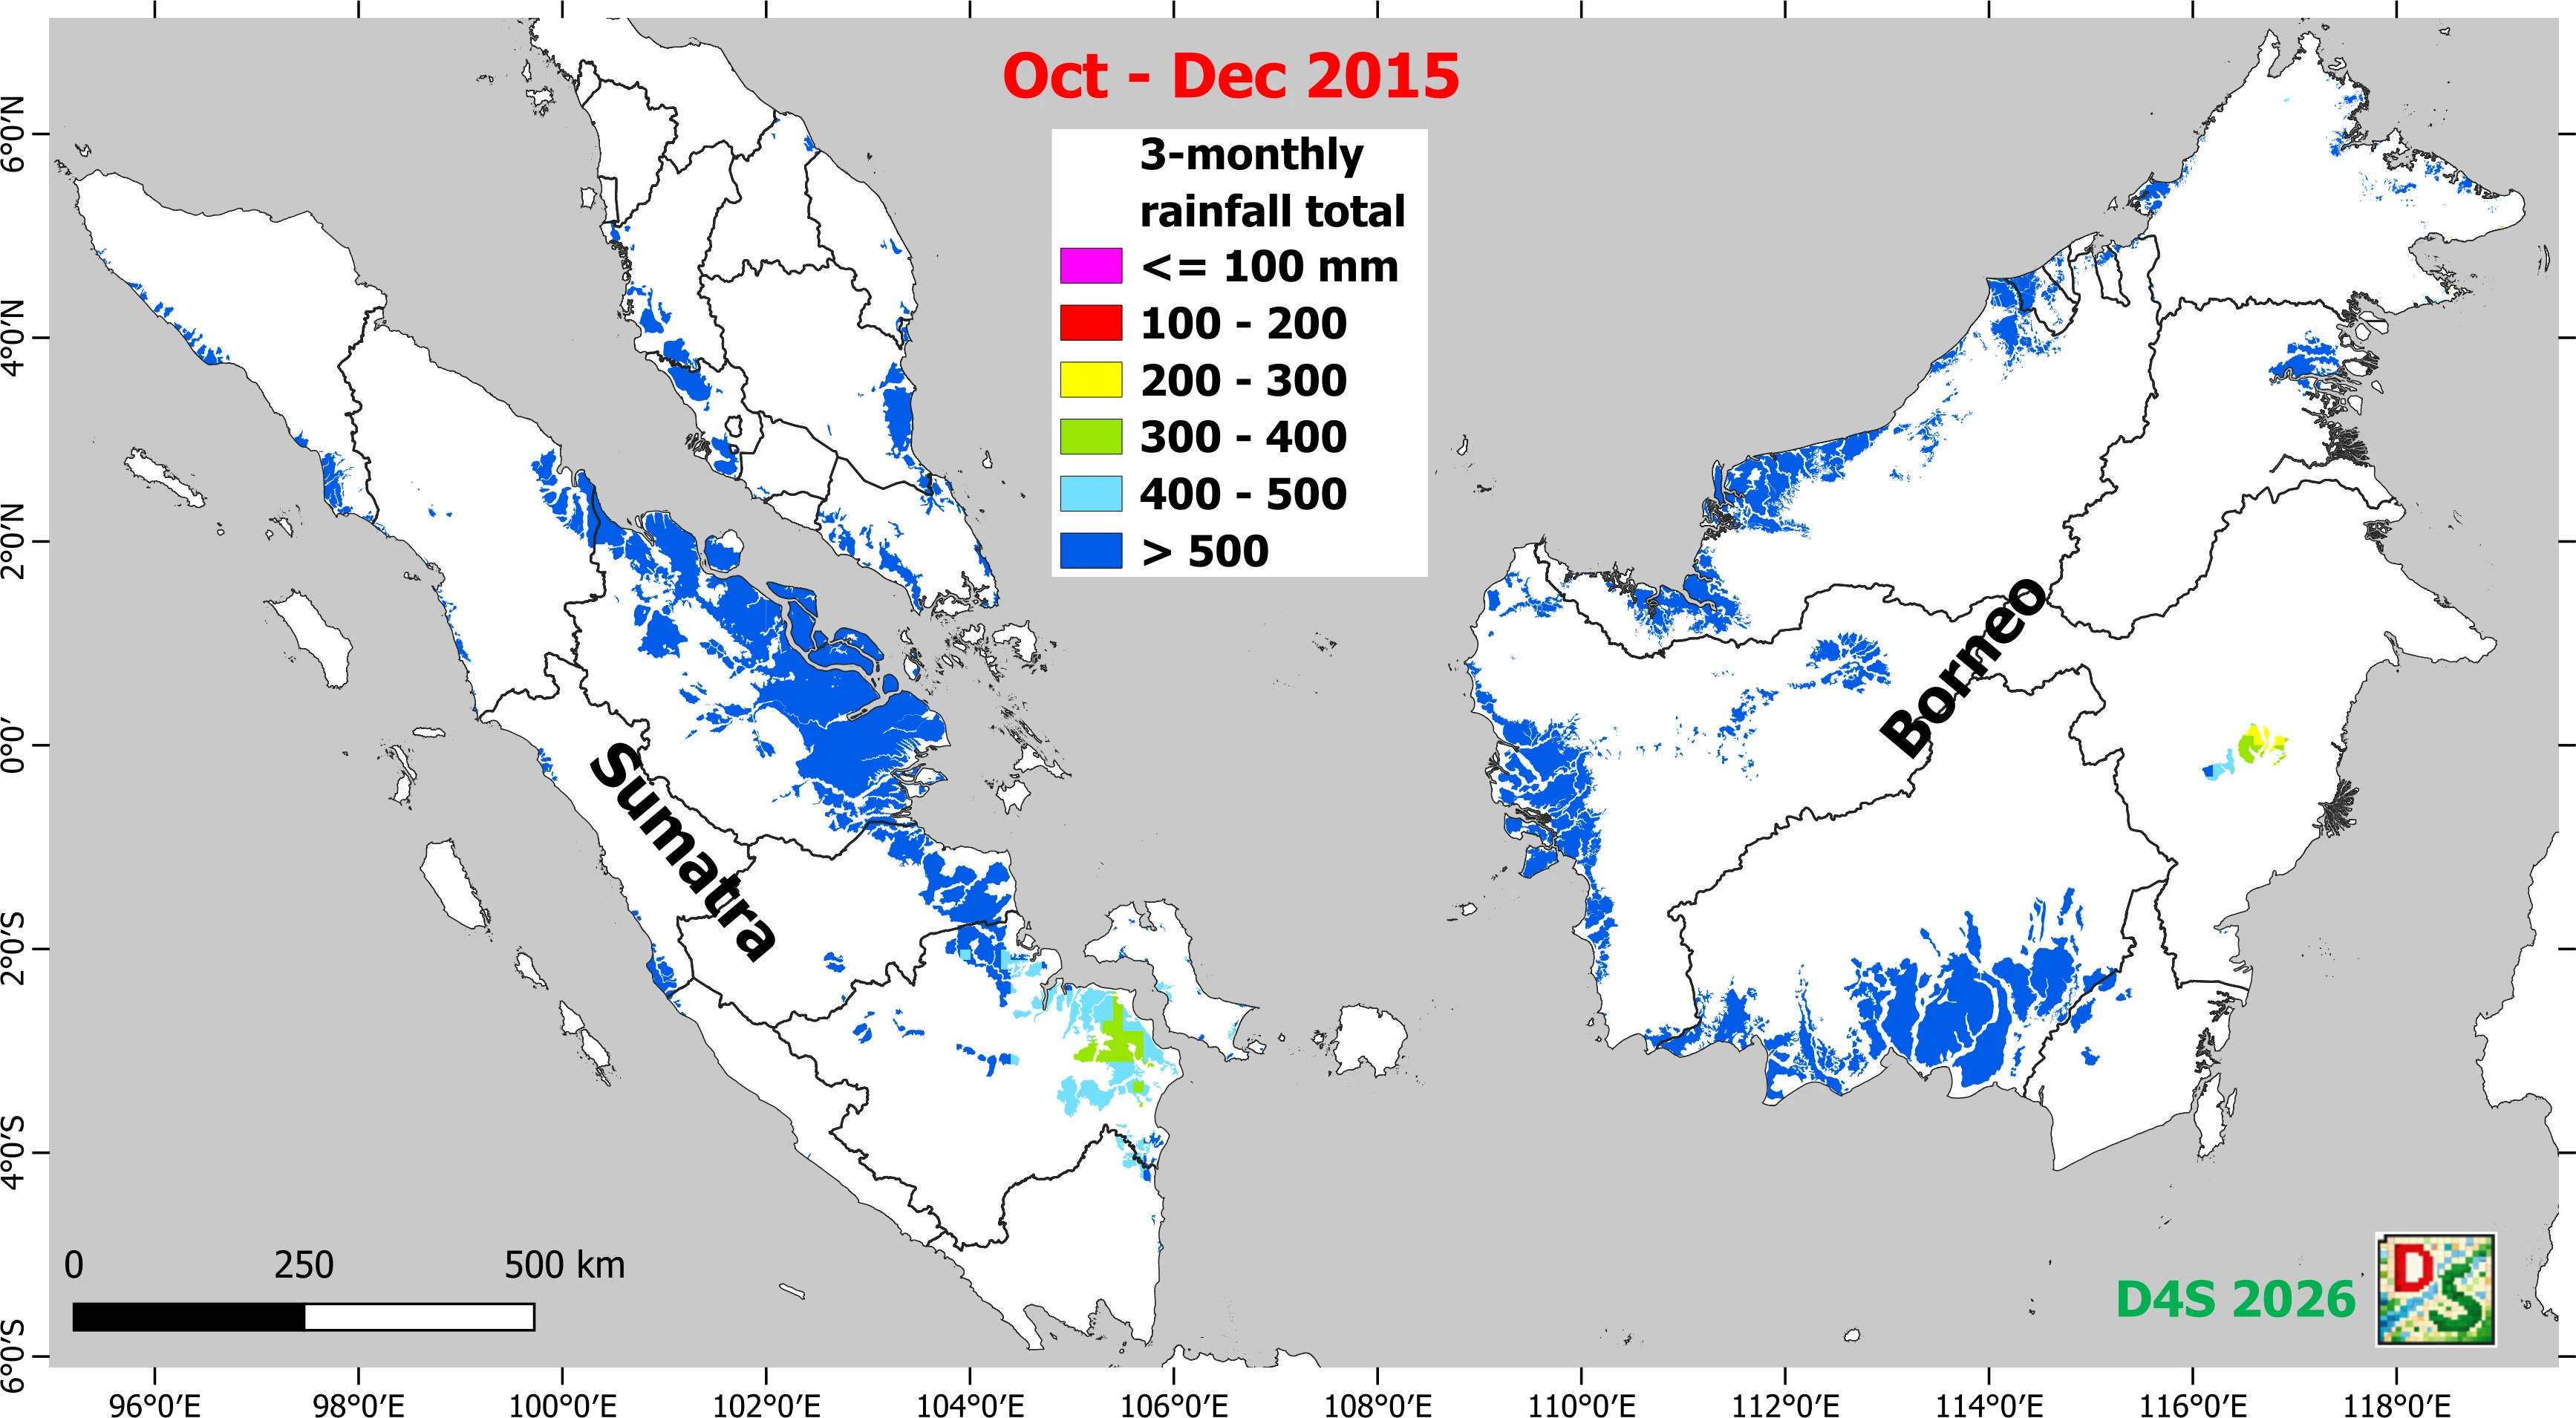
Each row shows, left to right: 3-month rainfall total, and modelled water table depth (last day of the month) for the same dry months (July - December) over the years 2015 and 2026.

2026
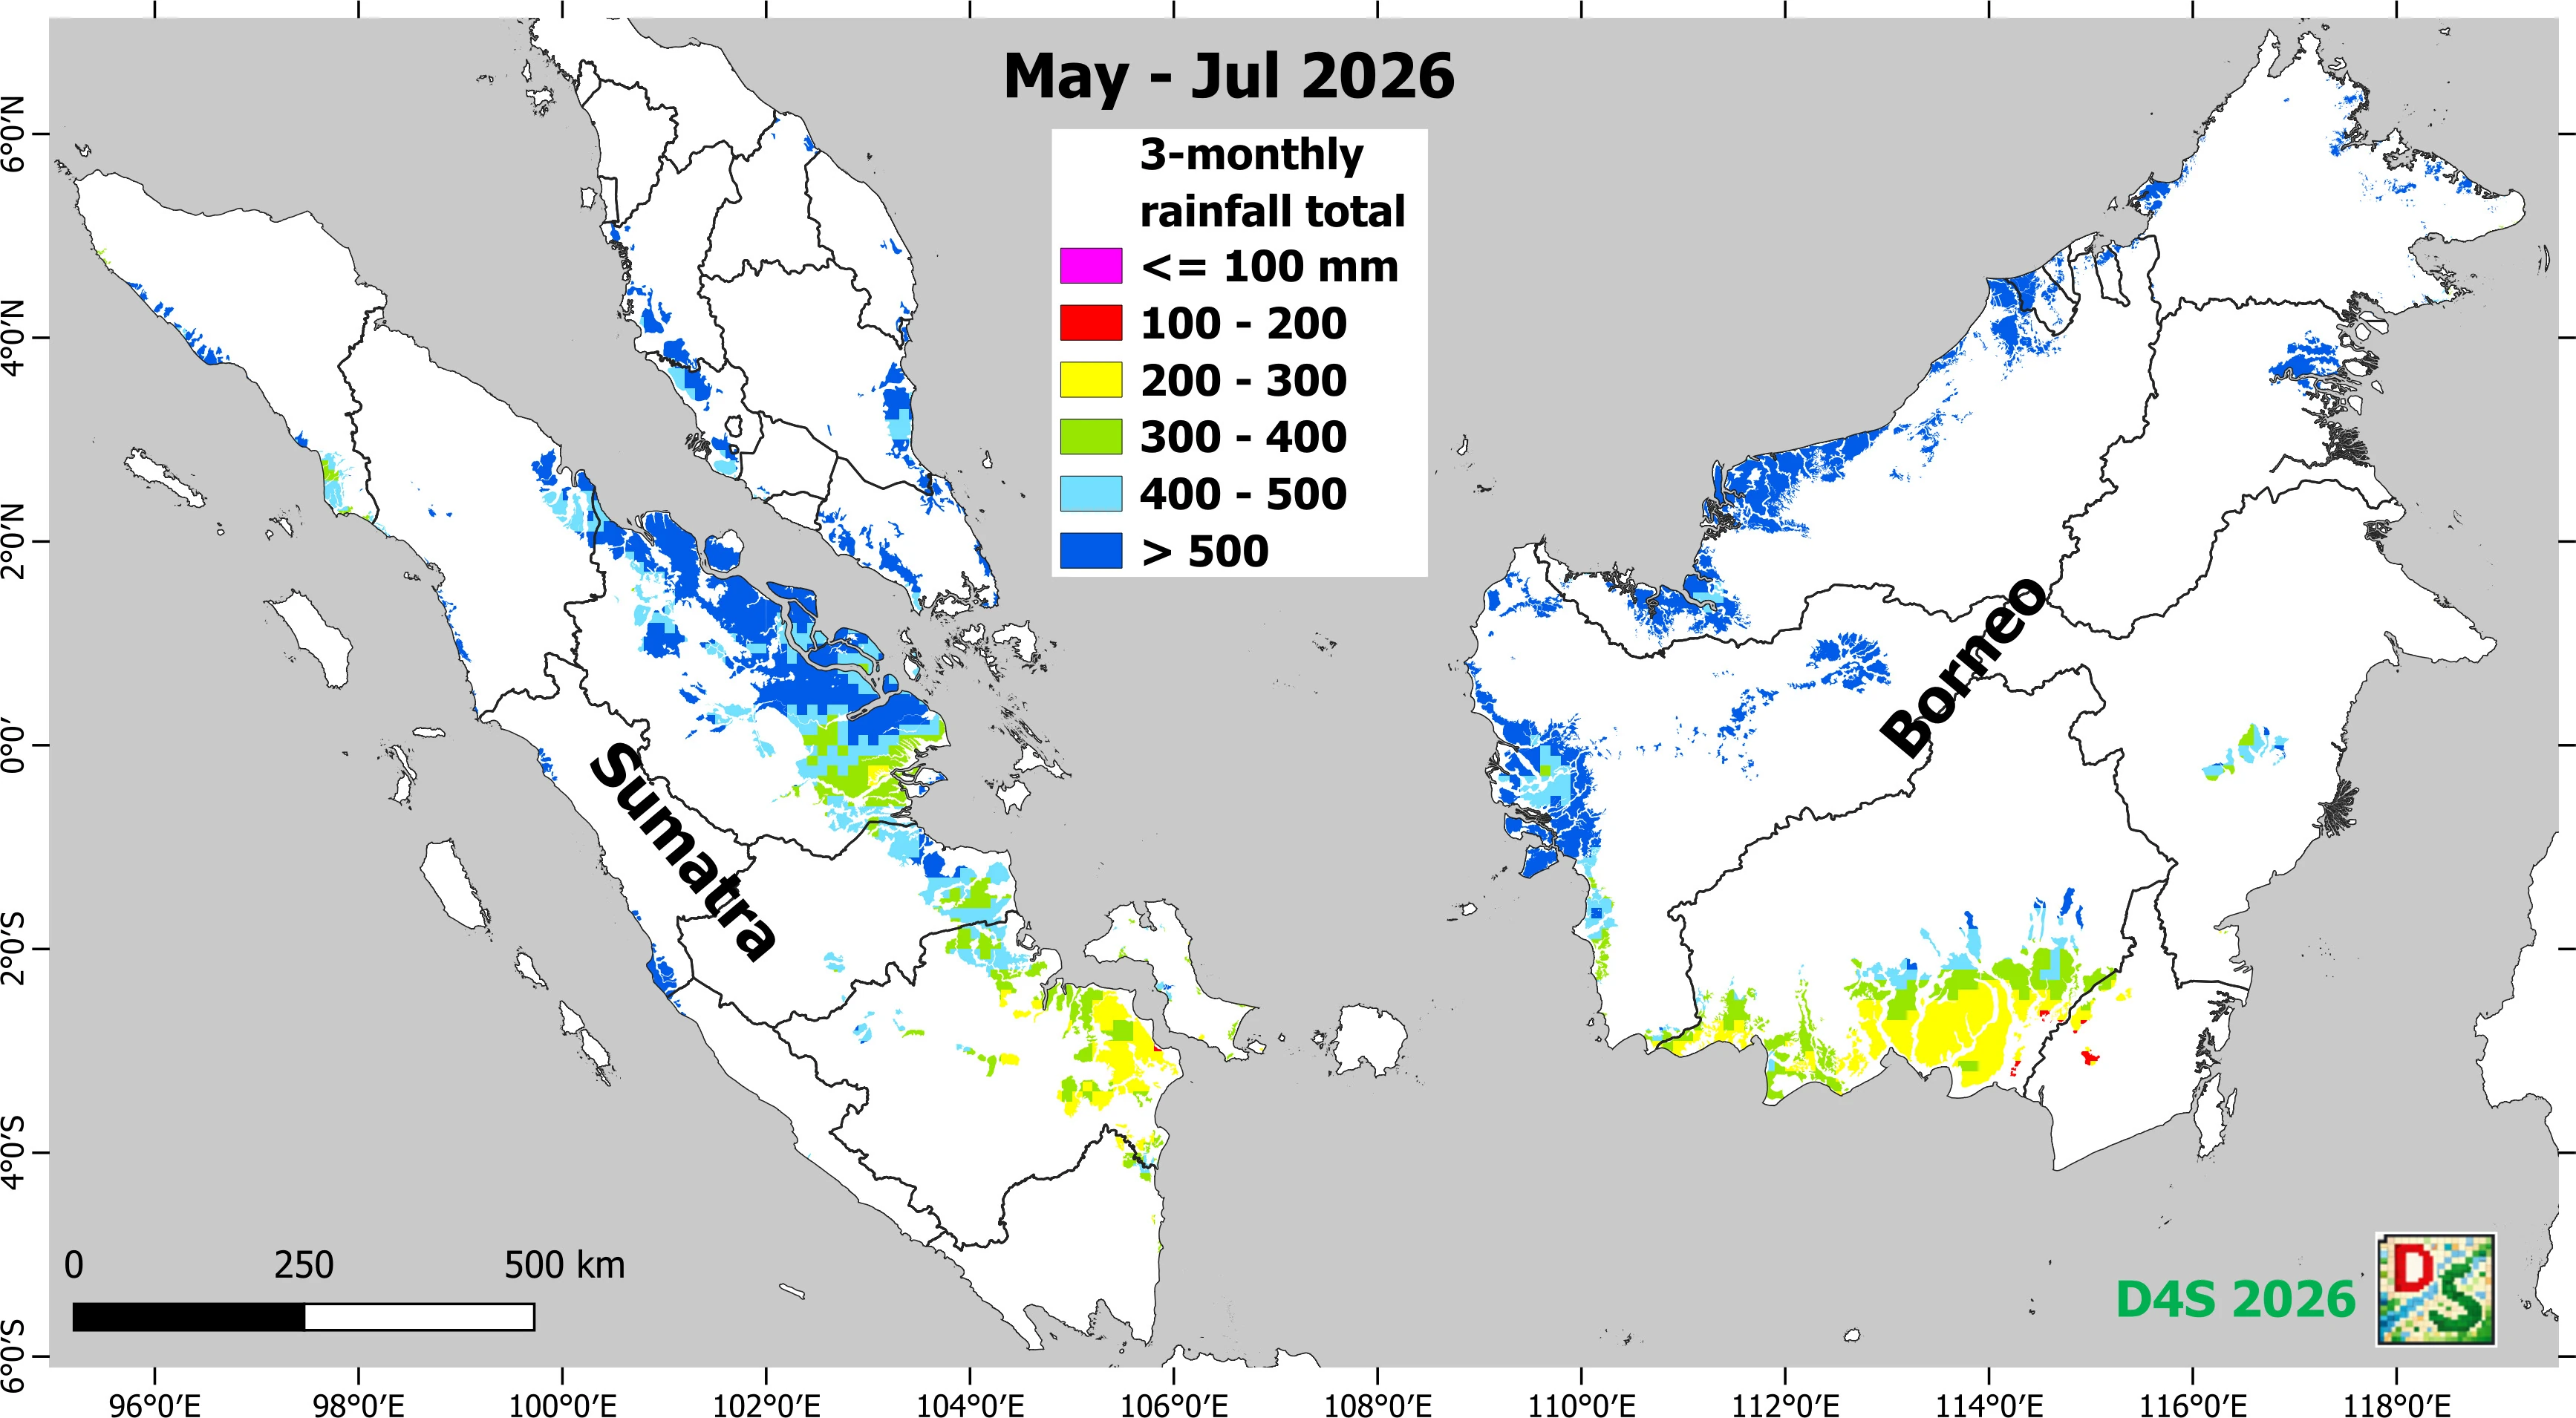
3-month rainfall total map
2026 water table depth map
3-month rainfall total map
2026 water table depth map
2015
3-month rainfall total map
2015 water table depth map
3-month rainfall total map
2015 water table depth map
3-month rainfall total map
2015 water table depth map
3-month rainfall total map
2015 water table depth map
3-month rainfall total map
2015 water table depth map
3-month rainfall total map
2015 water table depth map